

Question: The ANOVA summary table for an experiment with four groups, with five values in each group, is shown to the right. Complete parts (a) through
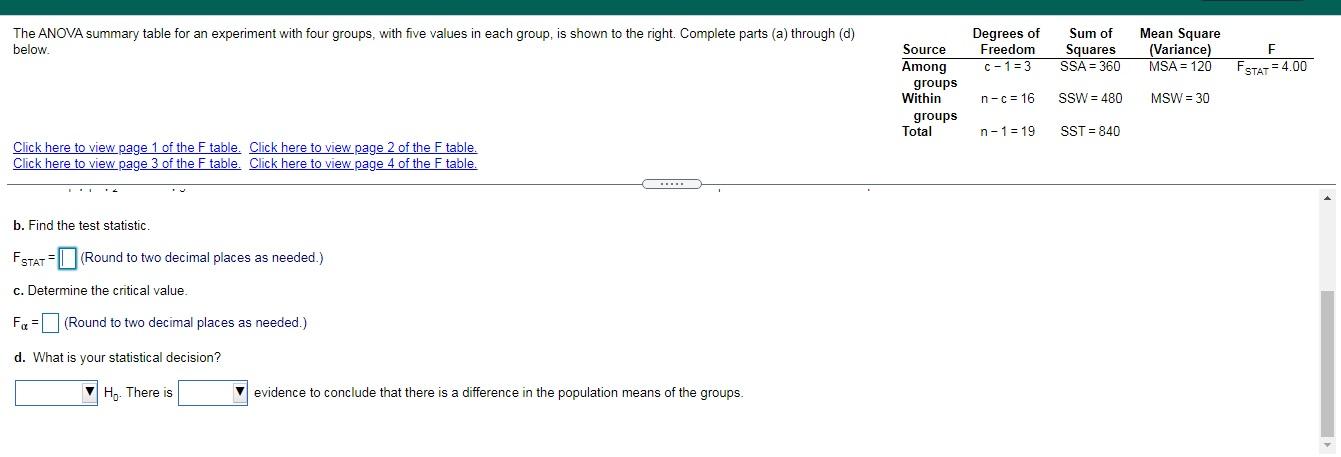
The ANOVA summary table for an experiment with four groups, with five values in each group, is shown to the right. Complete parts (a) through (d) Degrees of Sum of Mean Square below. Source Freedom Squares (Variance) F Among C- 1=3 SSA = 360 MSA = 120 FSTAT = 4.00 groups Within n - c = 16 SSW = 480 MSW = 30 groups Total n - 1 = 19 SST = 840 Click here to view page 1 of the F table. Click here to view page 2 of the F table. Click here to view page 3 of the F table. Click here to view page 4 of the F table. b. Find the test statistic. FSTAT =(Round to two decimal places as needed.) c. Determine the critical value. For =(Round to two decimal places as needed.) d. What is your statistical decision? Hy. There is evidence to conclude that there is a difference in the population means of the groups
Step by Step Solution
There are 3 Steps involved in it

Get step-by-step solutions from verified subject matter experts