

Question: The AON diagram shown represents a project. Normal and crash times, and the associated shown for each activity in the accompanying table. The project duration
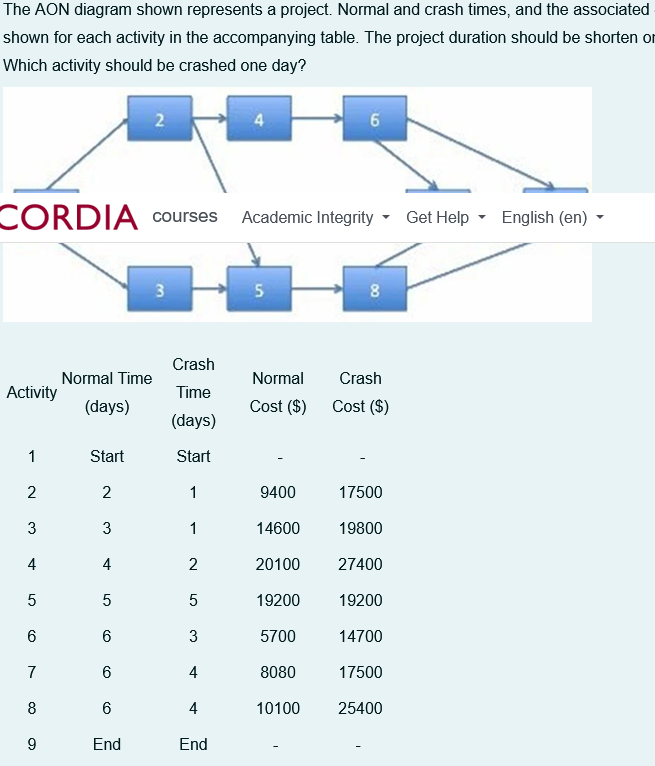
The AON diagram shown represents a project. Normal and crash times, and the associated shown for each activity in the accompanying table. The project duration should be shorten or Which activity should be crashed one day? 2 6 courses Academic Integrity Get Help English (en) CORDIA courses 3 5 8 Crash Normal Time Normal Crash Activity Time (days) Cost ($) Cost ($) (days) 1 Start Start 2 2 1 9400 17500 3 3 1 14600 19800 4 4 2 20100 27400 5 5 5 19200 19200 6 6 3 5700 14700 7 6 4 8080 17500 8 6 4 10100 25400 9 End End
Step by Step Solution
There are 3 Steps involved in it
1 Expert Approved Answer
Step: 1 Unlock

Question Has Been Solved by an Expert!
Get step-by-step solutions from verified subject matter experts
Step: 2 Unlock
Step: 3 Unlock