

Question: The associated Excel file contains a Machine-Part Indicator matrix for 22 parts and 11 machines. a.) Perform a group technology analysis using Row and Column
The associated Excel file contains a Machine-Part Indicator matrix for 22 parts and 11 machines.
a.) Perform a group technology analysis using Row and Column Masking.
b.) Perform the same analysis using S-Link.
c.) Perform the same analysis one last time using A-Link. Compare your answers from A and the dendrograms from B and C. What grouping would you recommend form each approach? Which do you think is the best and why?
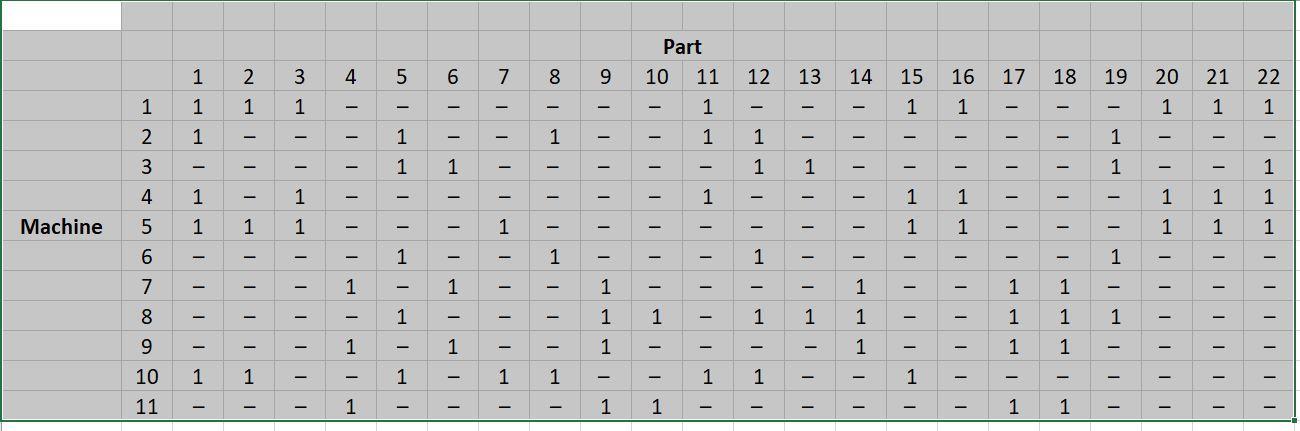
Machine TEMA 10 11 1 1 1 1 1 - - - 2 - - 1 - - - 1 1 3 4 1 - 1 1 - - - - - - - 1 - 1 - 1 5 - 1 1 - - 1 1 - 1 6 - - 1 - - 1 - 1 - - 7 - - - 1 - - - - 1 8 - 1 - - 1 - - 1 9 - - - - 1 1 1 - 1 Part 10 11 1 1 - - - - - - - 1 - - 1 1 - - - - 12 - - 1 1 - - 1 1 - 1 1 13 - - 1 - - - 1 - - 14 - - - 1 1 1 - 15 1 41 - - 1 1 - - - 1 - 16 1 - 1 1 - - - - 17 - - - - - 1 1 1 - 1 18 1 - 1 - - 1 1 1 - 1 19 - 1 1 - - 1 - 1 - - I 20 1 - 1 1 - - - - 21 1 1 1 - - -- - 22 1 - 1 1 1 - -
Step by Step Solution
3.57 Rating (150 Votes )
There are 3 Steps involved in it
Group Technology Analysis using Row and Column Masking This involves rearranging the rows and column... View full answer

Get step-by-step solutions from verified subject matter experts