

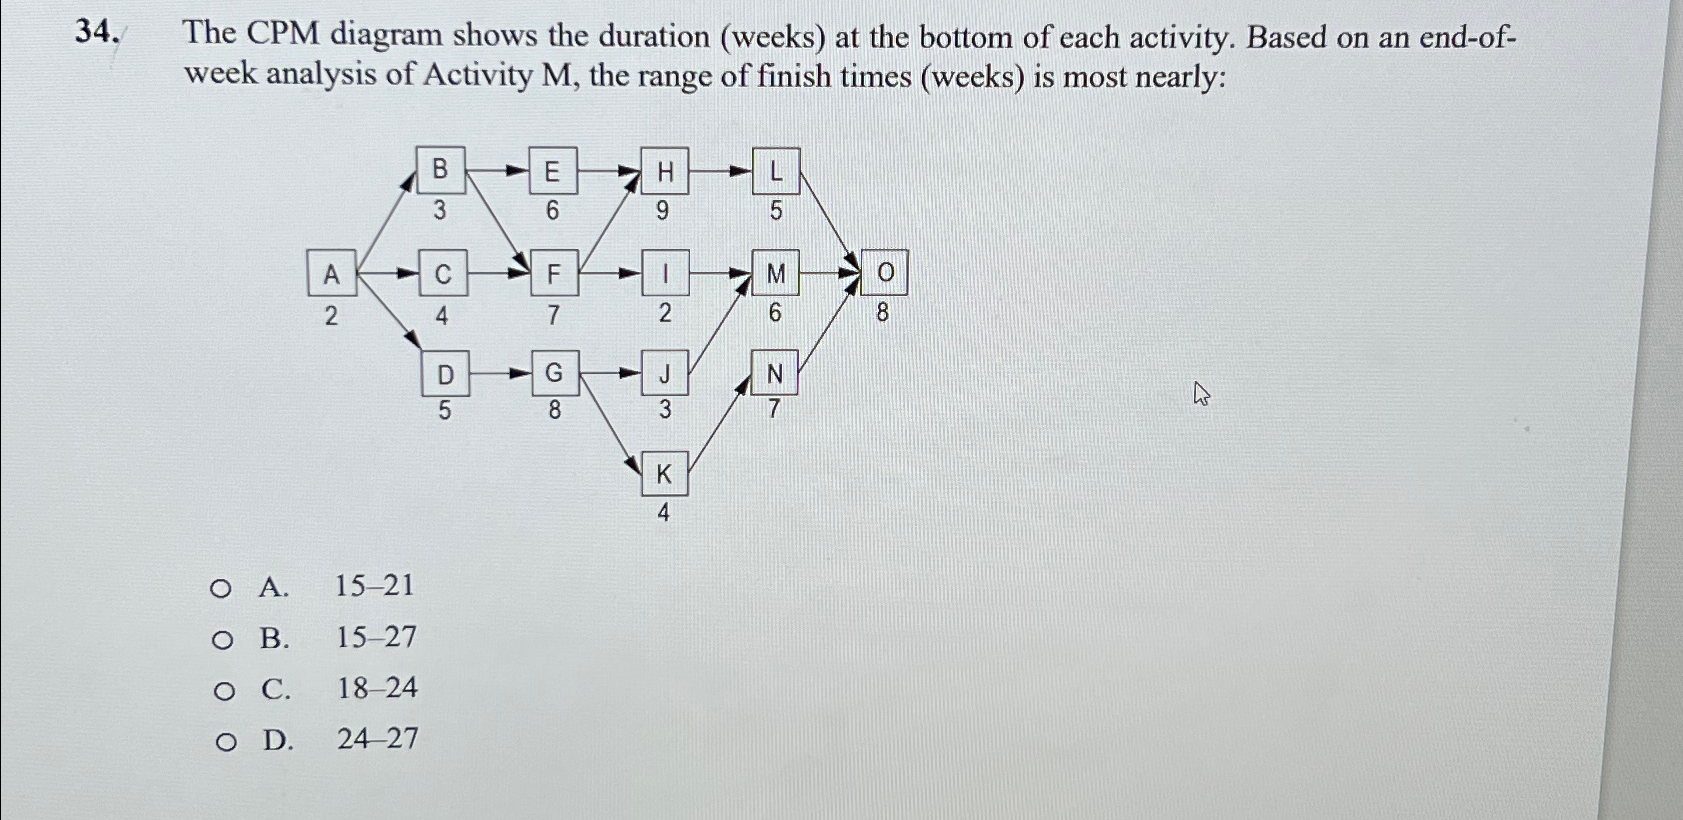
Question: The CPM diagram shows the duration ( weeks ) at the bottom of each activity. Based on an end - ofweek analysis of Activity M
The CPM diagram shows the duration weeks at the bottom of each activity. Based on an endofweek analysis of Activity M the range of finish times weeks is most nearly:
A
B
C
D
Step by Step Solution
There are 3 Steps involved in it
1 Expert Approved Answer
Step: 1 Unlock

Question Has Been Solved by an Expert!
Get step-by-step solutions from verified subject matter experts
Step: 2 Unlock
Step: 3 Unlock