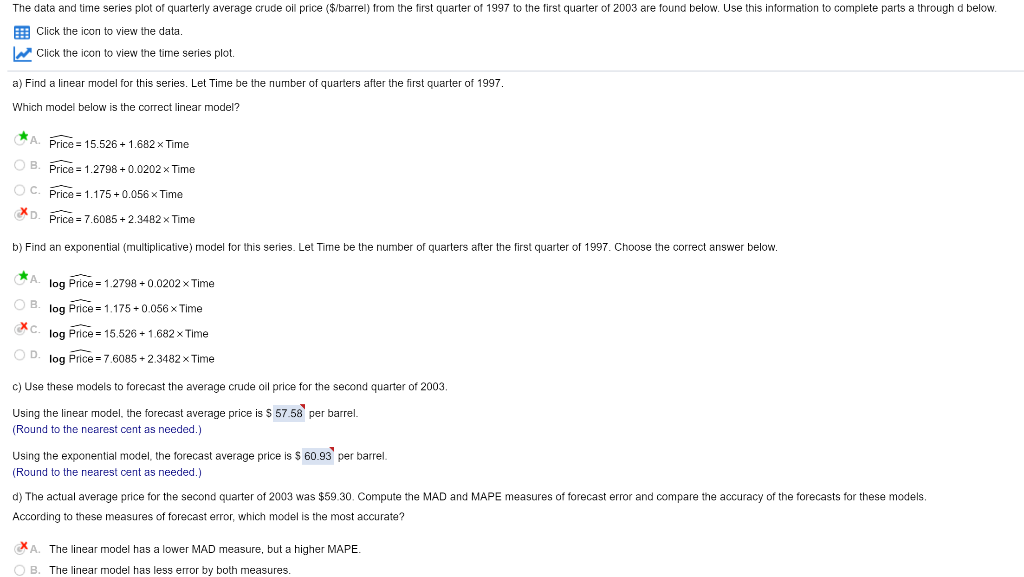
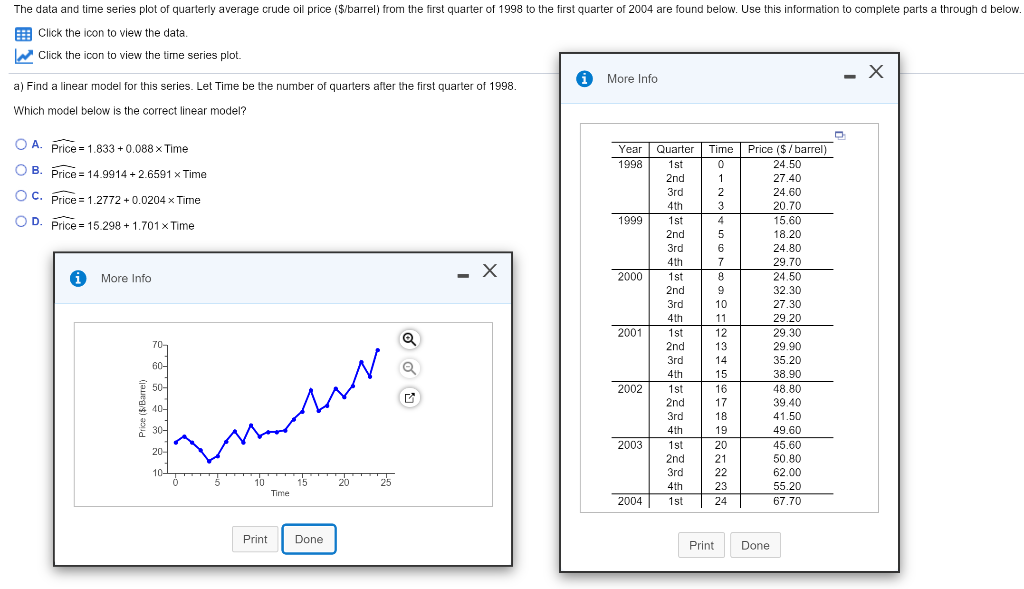
Question: The data and time series plot of quarterly average crude oil price ($/barrel) from the first quarter of 1997 to the first quarter of 2003

The data and time series plot of quarterlyThe data and time series plot of quarterly

The data and time series plot of quarterly average crude oil price ($/barrel) from the first quarter of 1997 to the first quarter of 2003 are found below. Use this information to complete parts a through d below. Click the icon to view the data. Click the icon to view the time series plot. a) Find a linear model for this series. Let Time be the number quarters after the first quarter of 1997, Which model below is the correct linear model? A. Price = 15.526 + 1.682 x Time OB. Price = 1.2798 +0.0202 x Time OC. Price = 1.175 +0.056 x Time XD. Price = 7.6085 +2.3482 x Time b) Find an exponential (multiplicative) model for this series. Let Time be the number of quarters after the first quarter of 1997. Choose the correct answer below. log Price = 1.2798 +0.0202 x Time O Blog Price = 1.175 +0.056 x Time log Price = 15.526 +1.682 x Time OD log Price = 7.6085 +2.3482 x Time c) Use these models to forecast the average crude oil price for the second quarter of 2003. Using the linear model, the forecast average price is $ 57.58 per barrel. (Round to the nearest cent as needed.) Using the exponential model, the forecast average price is $ 60.93 per barrel. (Round to the nearest cent as needed.) d) The actual average price for the second quarter of 2003 was $59.30. Compute the MAD and MAPE measures of forecast error and compare the accuracy of the forecasts for these models. According to these measures of forecast error, which model is the most accurate? XA. The linear model has a lower MAD measure, but a higher MAPE. OB. The linear model has less error by both measures. The data and time series plot of quarterly average crude oil price ($/barrel) from the first quarter of 1998 to the first quarter of 2004 are found below. Use this information to complete parts a through d below. :: Click the icon to view the data Click the icon to view the time series plot 1 More Info a) Find a linear model for this series. Let Time be the number of quarters after the first quarter of 1998. Which model below is the correct linear model? O A. Price = 1.833 +0.088 x Time Year 1998 Time 0 OB. Price = 14.9914 +2.6591 x Time 1 2 3 OC. Price = 1.2772 +0.0204 x Time OD. Price = 15.298 +1.701 x Time 1999 i More Info 2000 Quarter 1st 2nd 3rd 4th 1 st 2nd 3rd 4th 1 st 2nd 3rd 4th 1 st 2nd 3rd 4th 1 st 2nd 3rd 4th 1st 2nd 3rd 4th 1st 2001 Price ($/barrel) 24.50 27.40 24.60 20.70 15.60 18.20 24.80 29.70 24.50 32.30 27.30 29.20 29 30 29.90 35.20 38.90 48.80 39 40 41.50 49.60 45.60 50.80 62.00 55.20 67.70 70 60- 4 5 6 7 8 9 10 11 12 13 14 15 16 17 18 19 20 21 22 23 24 mura 50- 2002 40- 30- 2003 20 101 10 15 20 25 Time 2004 Print Done Print Done

Step by Step Solution

There are 3 Steps involved in it

1 Expert Approved Answer
Step: 1 Unlock blur-text-image
Question Has Been Solved by an Expert!

Get step-by-step solutions from verified subject matter experts

Step: 2 Unlock
Step: 3 Unlock

Students Have Also Explored These Related General Management Questions!