

Question: The data for questions 28 through 36 is at the bottom of the Exhibit spreadsheet labelled Exhibit II. PACCAR is a manufacturer of trailer-truck


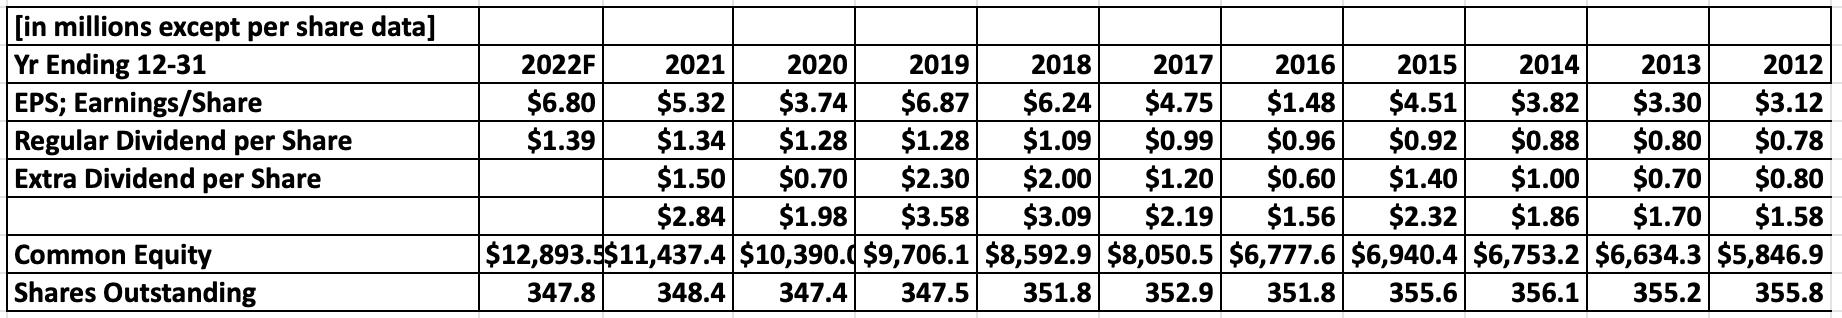
The data for questions 28 through 36 is at the bottom of the Exhibit spreadsheet labelled Exhibit II. PACCAR is a manufacturer of trailer-truck cabs and demand for cabs is cyclical. PACCAR shares are currently priced at $101. Data for fiscal 2022, which ends on December 31, is forecast and you believe the 2012 to 2022 data reasonably reflects profitability over a business cycle [in reality it likely does not]. The Rate of Return required on PACCAR common is estimated at 8.50%. Using the data from 2012 through 2022, calculate normalized EPS for PACCAR using the average EPS. Round to 1 cent. Normalized EPS: Based on the normalized EPS, what is the PE Ratio? Round to 2 decimal places. PE Ratio: What is the average Return on Equity, or ROE, for PACCAR? Round to 2 decimal places or 1 basis point. Note the critical format for ROE is EPS, / Book Value or Net Income, / Common Equity... Average ROE: Calculate a normalized EPS forecast for fiscal 2023 using the average ROE and round to 1 cent. Normalized EPS based on ROE: Based on the normalized EPS forecast for 2023 using average ROE, what is the PE Ratio? Round to 2 decimal places. PE Ratio: 6 The data for questions 28 through 36 is at the bottom of the Exhibit spreadsheet labelled Exhibit II. PACCAR is a manufacturer of trailer-truck cabs and demand for cabs is cyclical. PACCAR shares are currently priced at $101. Data for fiscal 2022, which ends on December 31, is forecast and you believe the 2012 to 2022 data reasonably reflects profitability over a business cycle [in reality it likely does not]. The Rate of Return required on PACCAR common is estimated at 8.50%. Using the data from 2012 through 2022, calculate normalized EPS for PACCAR using the average EPS. Round to 1 cent. Normalized EPS: Based on the normalized EPS, what is the PE Ratio? Round to 2 decimal places. PE Ratio: What is the average Return on Equity, or ROE, for PACCAR? Round to 2 decimal places or 1 basis point. Note the critical format for ROE is EPS, / Book Value or Net Income, / Common Equity... Average ROE: Calculate a normalized EPS forecast for fiscal 2023 using the average ROE and round to 1 cent. Normalized EPS based on ROE: Based on the normalized EPS forecast for 2023 using average ROE, what is the PE Ratio? Round to 2 decimal places. PE Ratio: 6 Calculate PACCAR's Residual Income per share for 2021 and round to one cent. 2021 Residual Income per share: Calculate PACCAR's Residual Income per share for 2022 and round to one cent. 2022 Residual Income per share: You forecast future Returns on Equity as shown on the Exhibit. Beginning in 2023, ROE is expected to decline to 16% and then proceed through a cycle and reach a steady state, long-term ROE of 15% in 2028. PACCAR's payout ratio is forecast to remain at 50% in the future. The consensus Rate of Return on PACCAR common is 8.50%. At the end of the forecast horizon, the premium of intrinsic value over book value is forecast to be 40%. Calculate the Intrinsic Value of a share of common and round to one cent. IV: Rather than forecast the premium of intrinsic value over book value, Book Value is forecast to grow at a constant 2.50% beginning in 2029. Calculate the Intrinsic Value of a share of common and round to one cent. IV: Calculate PACCAR's Residual Income per share for 2021 and round to one cent. 2021 Residual Income per share: Calculate PACCAR's Residual Income per share for 2022 and round to one cent. 2022 Residual Income per share: You forecast future Returns on Equity as shown on the Exhibit. Beginning in 2023, ROE is expected to decline to 16% and then proceed through a cycle and reach a steady state, long-term ROE of 15% in 2028. PACCAR's payout ratio is forecast to remain at 50% in the future. The consensus Rate of Return on PACCAR common is 8.50%. At the end of the forecast horizon, the premium of intrinsic value over book value is forecast to be 40%. Calculate the Intrinsic Value of a share of common and round to one cent. IV: Rather than forecast the premium of intrinsic value over book value, Book Value is forecast to grow at a constant 2.50% beginning in 2029. Calculate the Intrinsic Value of a share of common and round to one cent. IV: [in millions except per share data] Yr Ending 12-31 EPS; Earnings/Share Regular Dividend per Share Extra Dividend per Share Common Equity Shares Outstanding 2022F 2021 2020 2016 2015 2014 2013 2012 $1.48 $4.51 $3.82 $3.30 $3.12 $6.80 $5.32 $3.74 $1.39 $1.34 $1.28 $1.50 $0.70 2019 2018 2017 $6.87 $6.24 $4.75 $1.28 $1.09 $0.99 $2.30 $2.00 $1.20 $0.96 $0.92 $0.88 $0.80 $0.78 $0.60 $1.40 $1.00 $0.70 $0.80 $3.58 $3.09 $2.19 $1.56 $2.32 $1.86 $1.70 $1.58 |$12,893.5$11,437.4 $10,390.0 $9,706.1 $8,592.9 $8,050.5 $6,777.6 $6,940.4 $6,753.2 $6,634.3 $5,846.9 351.8 355.6 356.1 355.2 355.8 $2.84 $1.98 347.8 348.4 347.4 347.5 351.8 352.9
Step by Step Solution
3.39 Rating (158 Votes )
There are 3 Steps involved in it
Normalized EPS 720 PE Ratio 1291 Average ROE 1627 Normalized EPS based on ROE 750 PE Ratio 1335 ... View full answer

Get step-by-step solutions from verified subject matter experts