

Question: The data in exhibit 2 represents the average grower price for the months of December and May as well as the average of the average
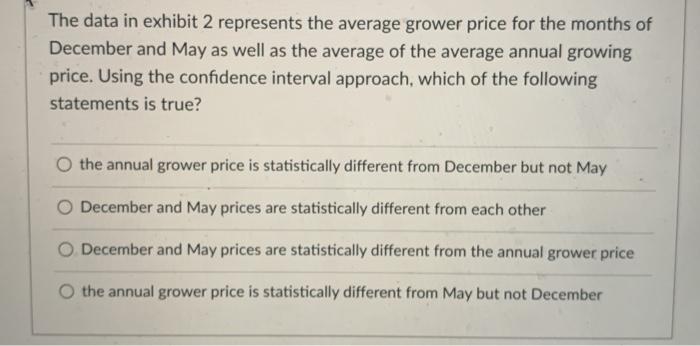
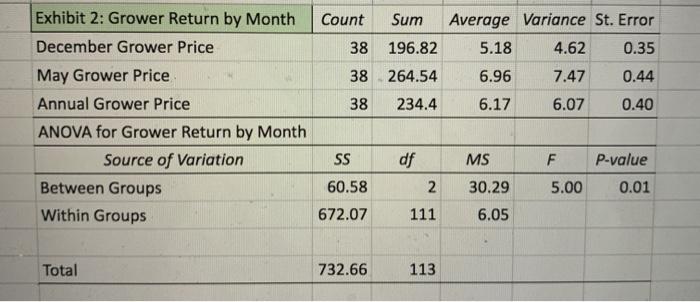
The data in exhibit 2 represents the average grower price for the months of December and May as well as the average of the average annual growing price. Using the confidence interval approach, which of the following statements is true? the annual grower price is statistically different from December but not May December and May prices are statistically different from each other December and May prices are statistically different from the annual grower price O the annual grower price is statistically different from May but not December Count Sum Average Variance St. Error 5.18 4.62 0.35 38 196.82 6.96 0.44 38 264.54 38 234.4 7.47 6.07 6.17 0.40 Exhibit 2: Grower Return by Month December Grower Price May Grower Price Annual Grower Price ANOVA for Grower Return by Month Source of Variation Between Groups Within Groups df MS F P-value SS 60.58 672.07 2 30.29 5.00 0.01 111 6.05 Total 732.66 113
Step by Step Solution
There are 3 Steps involved in it

Get step-by-step solutions from verified subject matter experts