

Question: The data in the table are used to create a calibration curve for the determination of RNA from its absorbance at 2 6 0 n
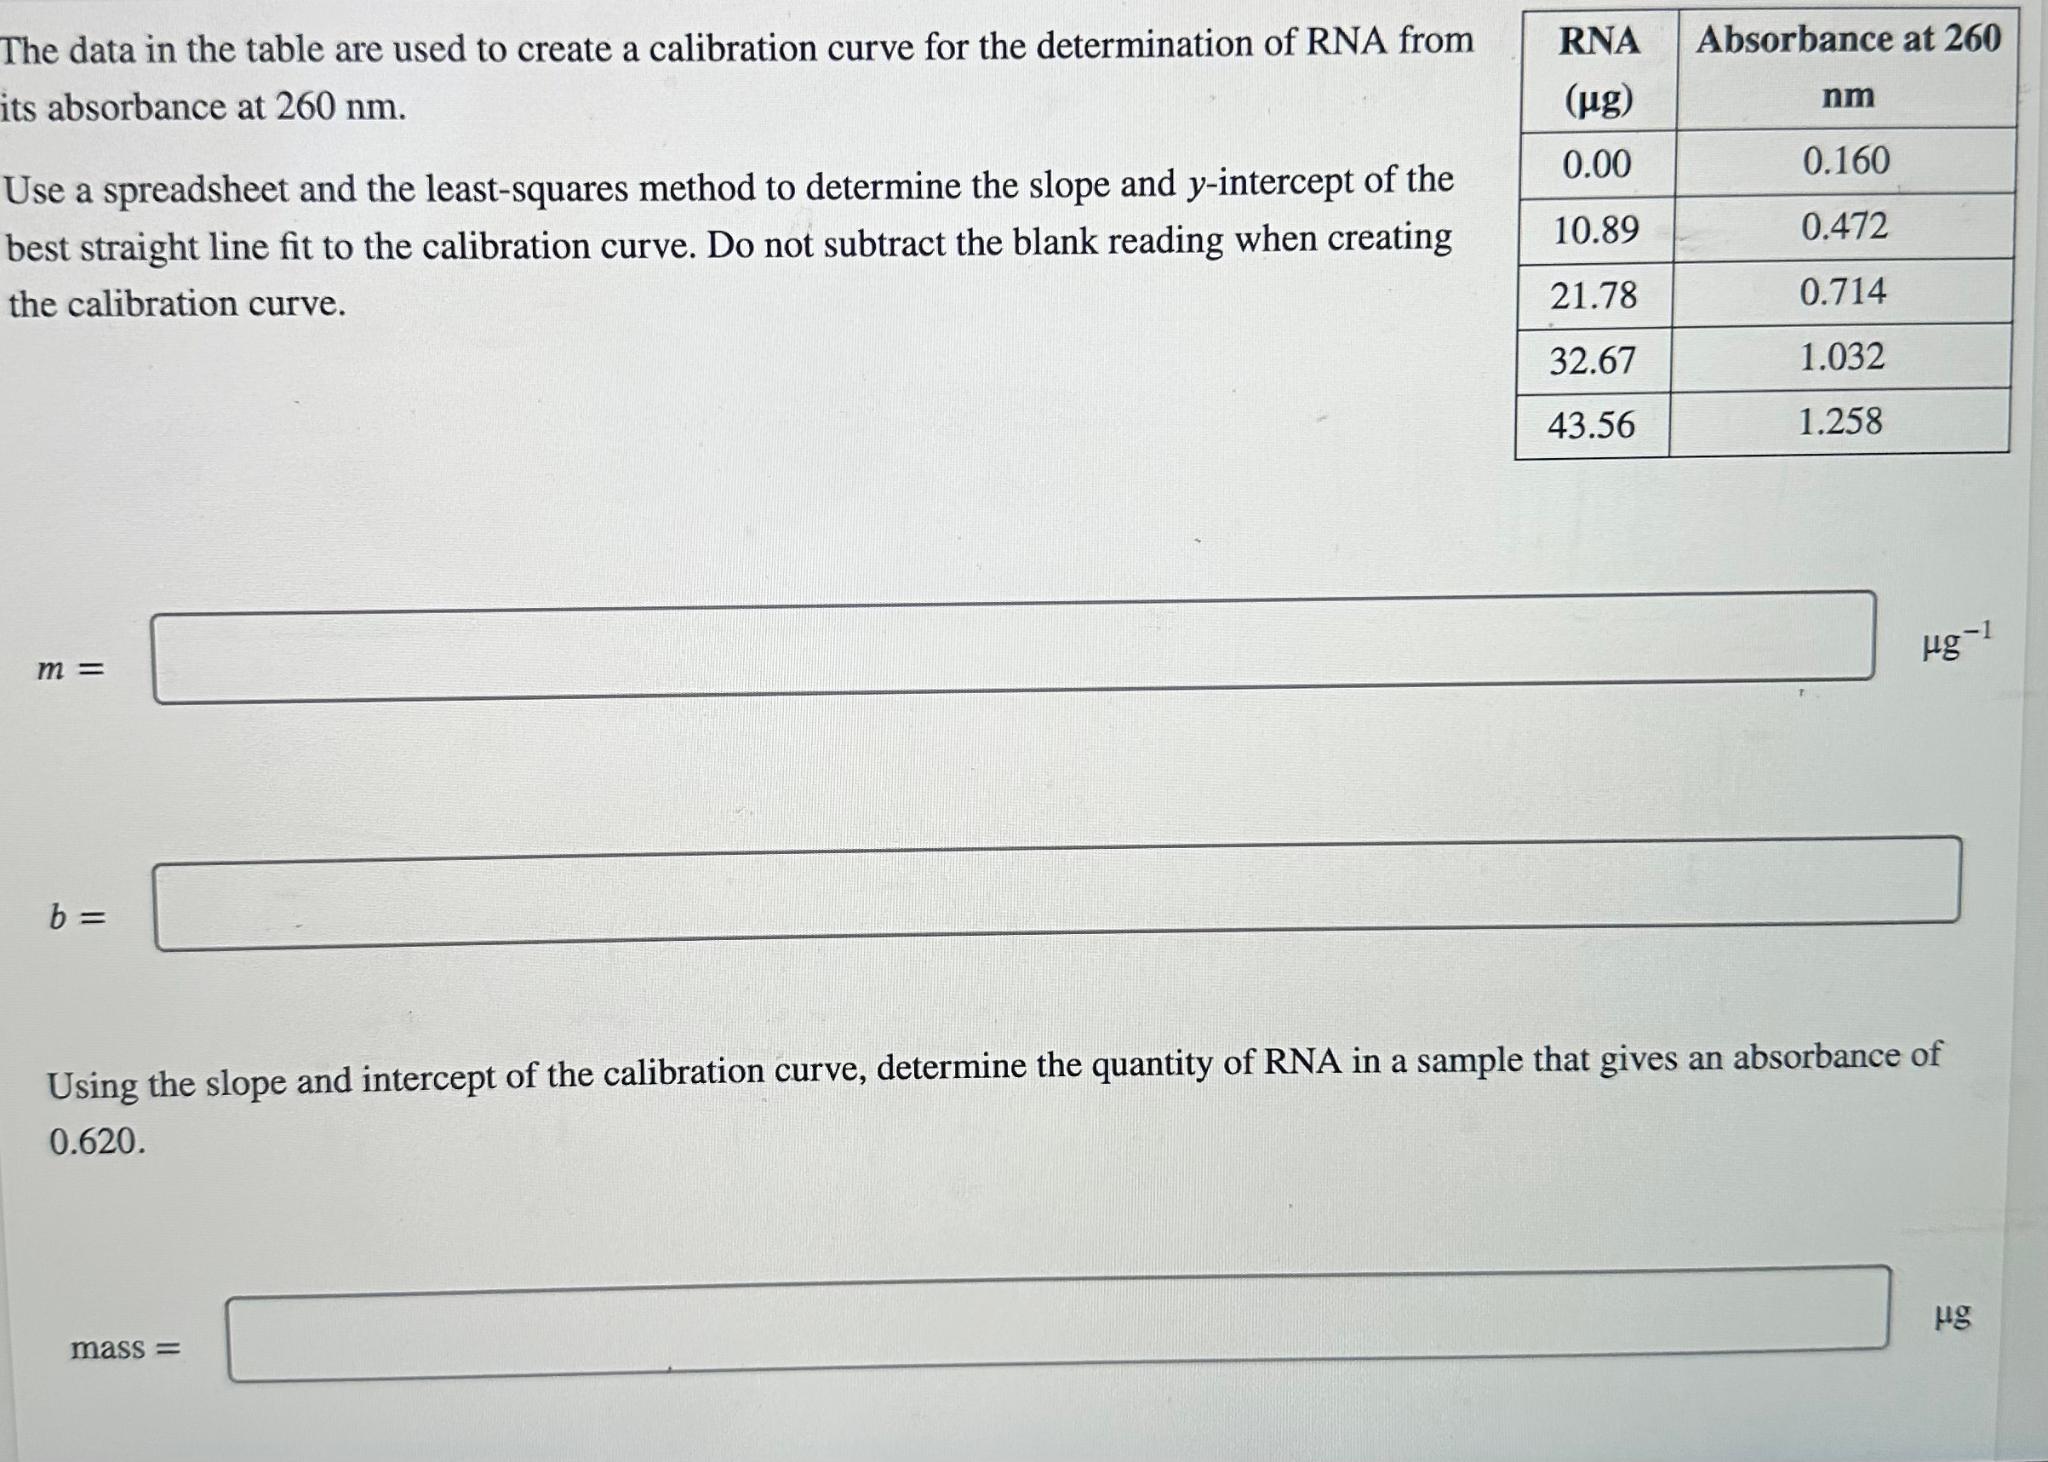
The data in the table are used to create a calibration curve for the determination of RNA from its absorbance at
Use a spreadsheet and the leastsquares method to determine the slope and intercept of the best straight line fit to the calibration curve. Do not subtract the blank reading when creating the calibration curve.
tabletableRNA
Step by Step Solution
There are 3 Steps involved in it
1 Expert Approved Answer
Step: 1 Unlock

Question Has Been Solved by an Expert!
Get step-by-step solutions from verified subject matter experts
Step: 2 Unlock
Step: 3 Unlock