

Question: The data in the table are used to create a calibration curve for the determination of RNA from its absorbance at 260nm. Use a spreadsheet
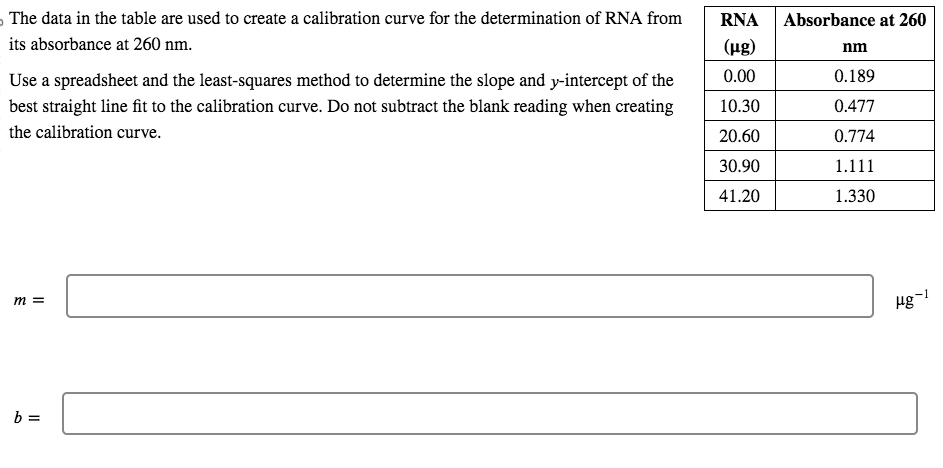
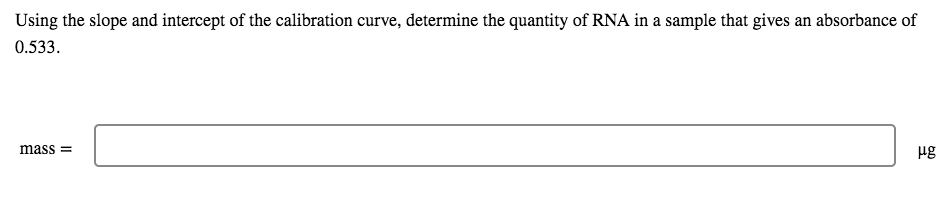
The data in the table are used to create a calibration curve for the determination of RNA from its absorbance at 260nm. Use a spreadsheet and the least-squares method to determine the slope and y-intercept of the best straight line fit to the calibration curve. Do not subtract the blank reading when creating the calibration curve. m= b: Using the slope and intercept of the calibration curve, determine the quantity of RNA in a sample that gives an absorbance of 0.533
Step by Step Solution
There are 3 Steps involved in it
1 Expert Approved Answer
Step: 1 Unlock

Question Has Been Solved by an Expert!
Get step-by-step solutions from verified subject matter experts
Step: 2 Unlock
Step: 3 Unlock