

Question: The data in the table below are temperature readings from a chemical process in C, taken every two minutes. (Read the observations down, from left.)
The data in the table below are temperature readings from a chemical process in C, taken every two minutes. (Read the observations down, from left.) The target value for the mean is = 950. (a) Estimate the process standard deviation. (b) Set up and apply a tabular CUSUM for this process, using standardized values h = 5 and k = 1/2. Interpret this chart. SOLVE IN EXCEL 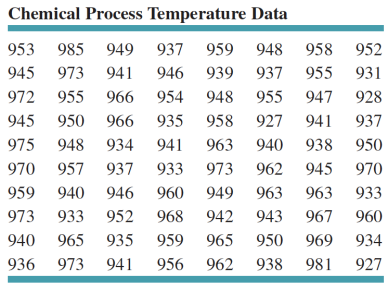
Chemical Process Temperature Data 953945972945975970959973940936985973955950948957940933965973949941966966934937946952935941937946954935941933960968959956959939948958963973949942965962948937955927940962963943950938958955947941938945963967969981952931928937950970933960934927
Step by Step Solution
There are 3 Steps involved in it
1 Expert Approved Answer
Step: 1 Unlock

Question Has Been Solved by an Expert!
Get step-by-step solutions from verified subject matter experts
Step: 2 Unlock
Step: 3 Unlock