

Question: The data shown below represent the age in weeks at which babies first crawl based on a survey of 12 mothers Complete parts a through
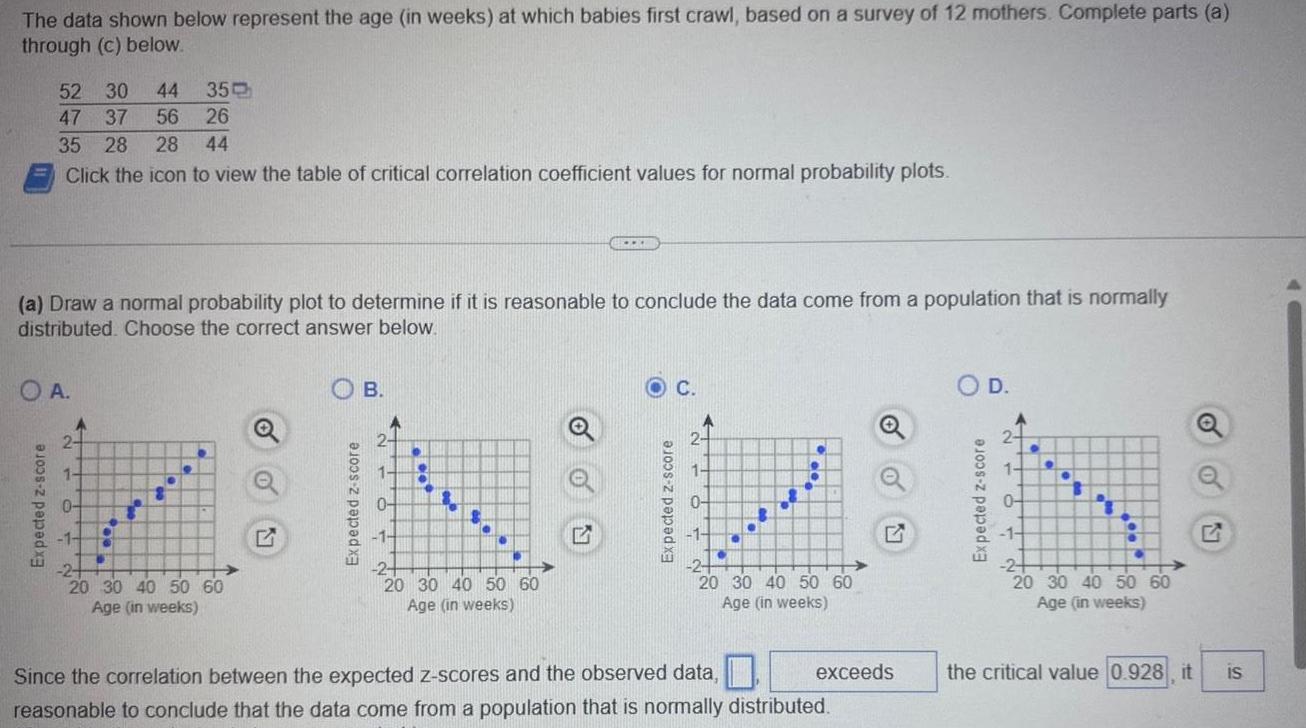

The data shown below represent the age in weeks at which babies first crawl based on a survey of 12 mothers Complete parts a through c below 52 30 44 35 47 37 56 26 35 28 28 44 Click the icon to view the table of critical correlation coefficient values for normal probability plots a Draw a normal probability plot to determine if it is reasonable to conclude the data come from a population that is normally distributed Choose the correct answer below O A 2 1 0 1 2 20 30 40 50 60 Age in weeks O B 20 30 40 50 60 Age in weeks C 20 30 40 50 60 Age in weeks exceeds Since the correlation between the expected z scores and the observed data reasonable to conclude that the data come from a population that is normally distributed D 20 30 40 50 60 Age in weeks the critical value 0 928 it o O IS 3279
Step by Step Solution
There are 3 Steps involved in it

Get step-by-step solutions from verified subject matter experts