

Question: The data shown below represent the age (in weeks) at which babies first crawl, based on a survey of 12 mothers. Complete parts (a) through
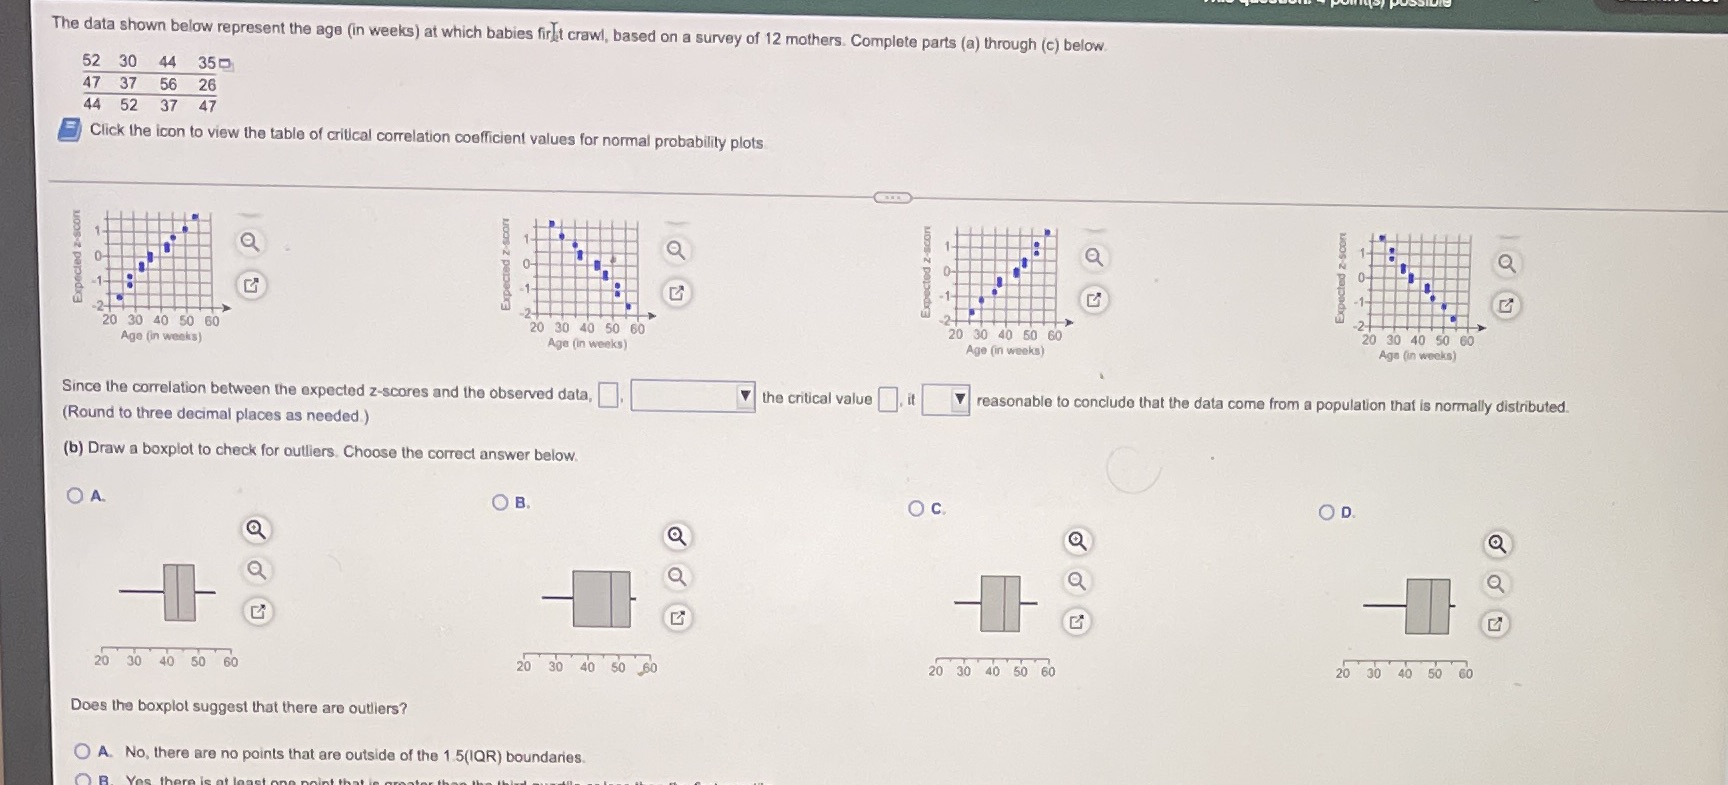
The data shown below represent the age (in weeks) at which babies first crawl, based on a survey of 12 mothers. Complete parts (a) through (c) below. 52 30 44 35 47 37 56 26 44 52 37 47 Click the icon to view the table of critical correlation coefficient values for normal probability plots a Q Expected z-scon Expected z-scar Expected z-score Expected z-scan -1- 2- -24 20 30 40 50 60 20 30 40 50 60 20 30 40 50 60 20 30 40 50 60 Age (in weeks) Age (in weeks) Age (in weeks) Aga (in weeks) Since the correlation between the expected z-scores and the observed data, the critical value . it V reasonable to conclude that the data come from a population that is normally distributed. (Round to three decimal places as needed.) (b) Draw a boxplot to check for outliers. Choose the correct answer below. O A. OB O c OD. Q Q a 20 30 40 50 60 20 30 40 50 60 20 30 40 50 60 20 30 40 50 60 Does the boxplot suggest that there are outliers? O A. No, there are no points that are outside of the 1.5(IQR) boundaries
Step by Step Solution
There are 3 Steps involved in it

Get step-by-step solutions from verified subject matter experts