

Question: The data shown below represent the age (in weeks) at which babies first crawl, based on a survey of 12 mothers. Complete parts (a) through


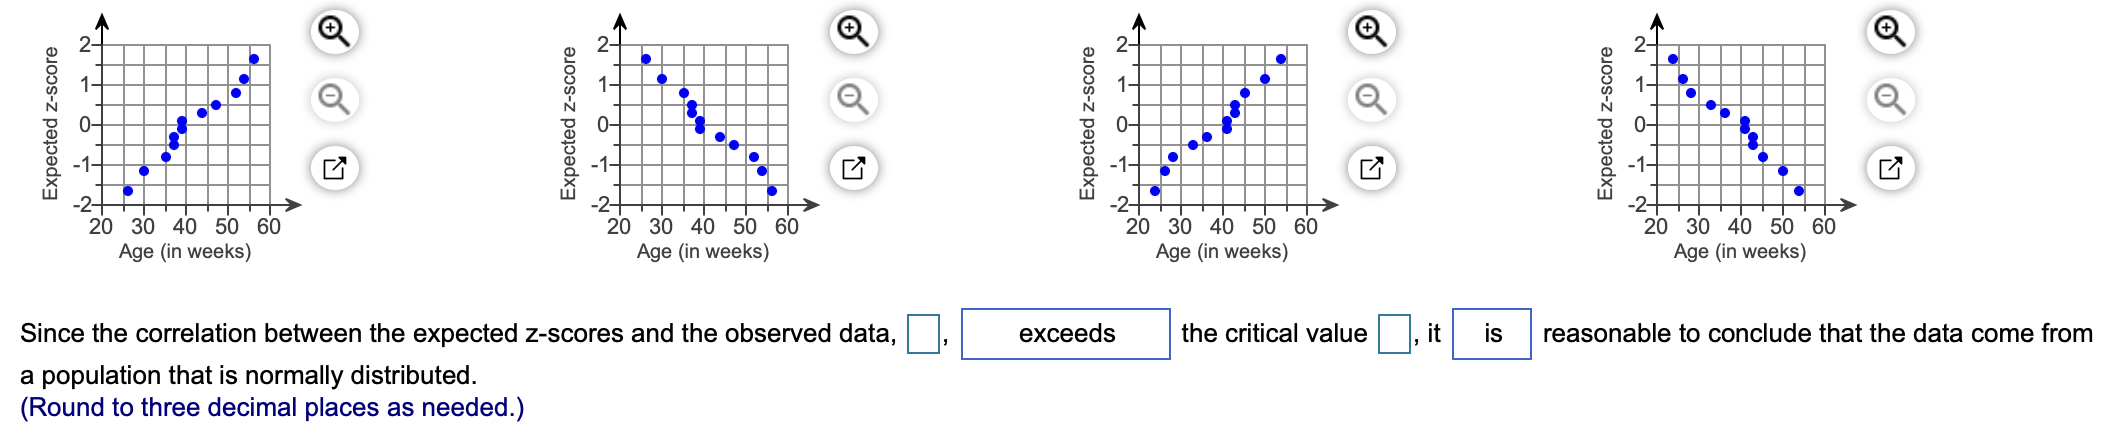
The data shown below represent the age (in weeks) at which babies first crawl, based on a survey of 12 mothers. Complete parts (a) through (c) below. 52 30 44 35 0 47 37 56 26 54 39 37 39Q A Q 52 52 1 1 3 ,. ' Q i: Q '5' '8 0 E' Q 4 . E} Q -1 E; m a w 4 20 30 40 50 60 20 30 40 50 60 Age (in weeks) Age (in weeks) Since the correlation between the expected z-scores and the observed data, a population that is normally distributed. (Round to three decimal places as needed.) A 52 Q 1 x Q g G '6 a4 a LIJ-2 20 30 4O 50 60 Age (in weeks) exceeds the critical value ,it is A E2 Q 1 5: Q g 0 '6 a4 a \"-2 20 30 40 50 60 Age (in weeks) reasonable to conclude that the data come from
Step by Step Solution
There are 3 Steps involved in it

Get step-by-step solutions from verified subject matter experts