

Question: The data shown below represent the age (in weeks) at which babies first crawl, based on a survey of 12 mothers. Complete parts (a) through

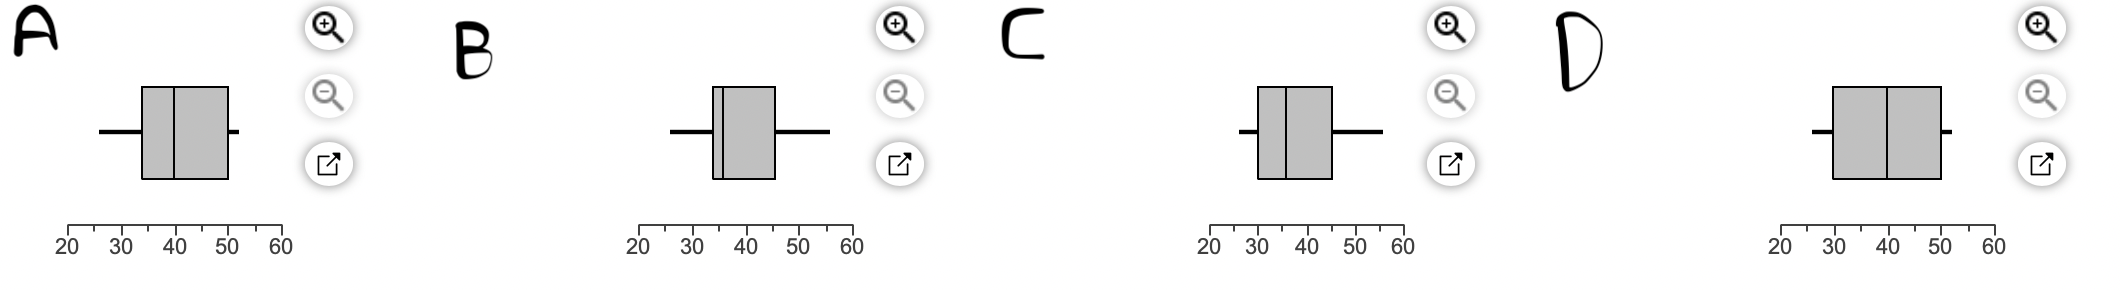


The data shown below represent the age (in weeks) at which babies first crawl, based on a survey of 12 mothers. Complete parts (a) through (c) below. 52 30 44 350 47 37 56 26 37 28 30 35Since the correlation between the expected z-scores and the observed data, 0.967 , exceeds the critical value 0.928 , it is reasonable to conclude that the data come from a population that is normally distributed. (Round to three decimal places as needed.) (b) Draw a boxplot to check for outliers. Choose the correct answer below. A B + C 20 30 40 50 60 20 30 40 50 60 20 30 40 50 60 20 30 40 50 60
Step by Step Solution
There are 3 Steps involved in it
1 Expert Approved Answer
Step: 1 Unlock

Question Has Been Solved by an Expert!
Get step-by-step solutions from verified subject matter experts
Step: 2 Unlock
Step: 3 Unlock