

Question: The data shown is for the saturation temperature as a function of pressure for R-134a. Develop 5 different curve fits: (a) Exponential [p = Aexp(aT)]
The data shown is for the saturation temperature as a function of pressure for R-134a. Develop 5 different curve fits:
(a) Exponential [p = A·exp(aT)]
(b) 2nd order polynomial
(c) Power Law [p = B·Tb]
(d) Logarithmic [p = A + B·ln(T)]
(e) Clausius-Clapeyron: [ln(P) = A – B/T]
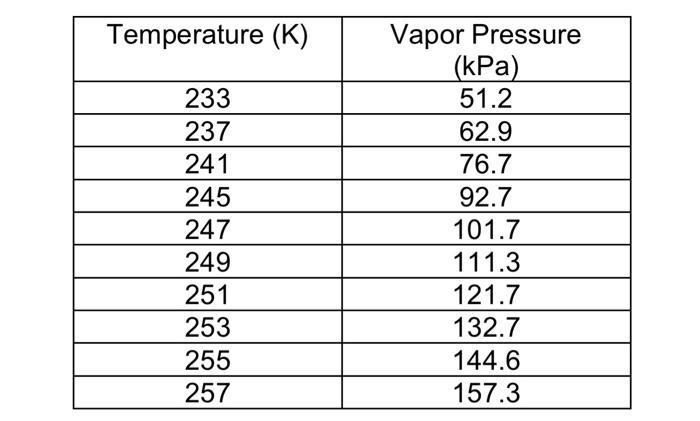
Temperature (K) 233 237 241 245 247 249 251 253 255 257 Vapor Pressure (kPa) 51.2 62.9 76.7 92.7 101.7 111.3 121.7 132.7 144.6 157.3
Step by Step Solution
3.45 Rating (152 Votes )
There are 3 Steps involved in it
To fit the data to various curve equations well use Python and the SciPy library Below are the fits for the provided data using different curve equati... View full answer

Get step-by-step solutions from verified subject matter experts