

Question: The depth of a river flowing in a rectangular channel 10 m wide is measured over a period of 23 hours following a period
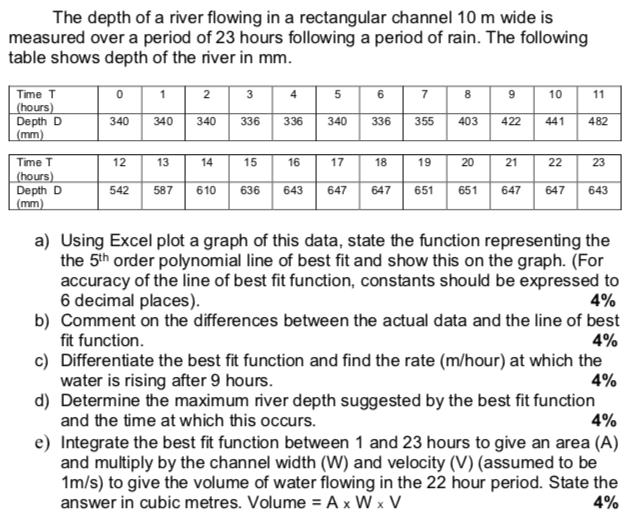
The depth of a river flowing in a rectangular channel 10 m wide is measured over a period of 23 hours following a period of rain. The following table shows depth of the river in mm. Time T (hours) Depth D (mm) Time T (hours) Depth D (mm) 0 1 340 340 12 13 2 3 4 5 6 7 340 336 336 340 336 355 14 542 587 610 15 16 17 18 19 8 9 403 422 20 21 636 643 647 647 651 651 647 10 441 22 647 11 482 23 643 a) Using Excel plot a graph of this data, state the function representing the the 5th order polynomial line of best fit and show this on the graph. (For accuracy of the line of best fit function, constants should be expressed to 6 decimal places). 4% b) Comment on the differences between the actual data and the line of best fit function. 4% c) Differentiate the best fit function and find the rate (m/hour) at which the water is rising after 9 hours. 4% d) Determine the maximum river depth suggested by the best fit function and the time at which this occurs. 4% e) Integrate the best fit function between 1 and 23 hours to give an area (A) and multiply by the channel width (W) and velocity (V) (assumed to be 1m/s) to give the volume of water flowing in the 22 hour period. State the answer in cubic metres. Volume =Ax W x V 4%
Step by Step Solution
3.49 Rating (149 Votes )
There are 3 Steps involved in it
a The given table of data along with the best fit line is plotted in Excel and is as shown below b From the image given above we deduce the following 1 The 5th order polynomial best fit line closely r... View full answer

Get step-by-step solutions from verified subject matter experts