

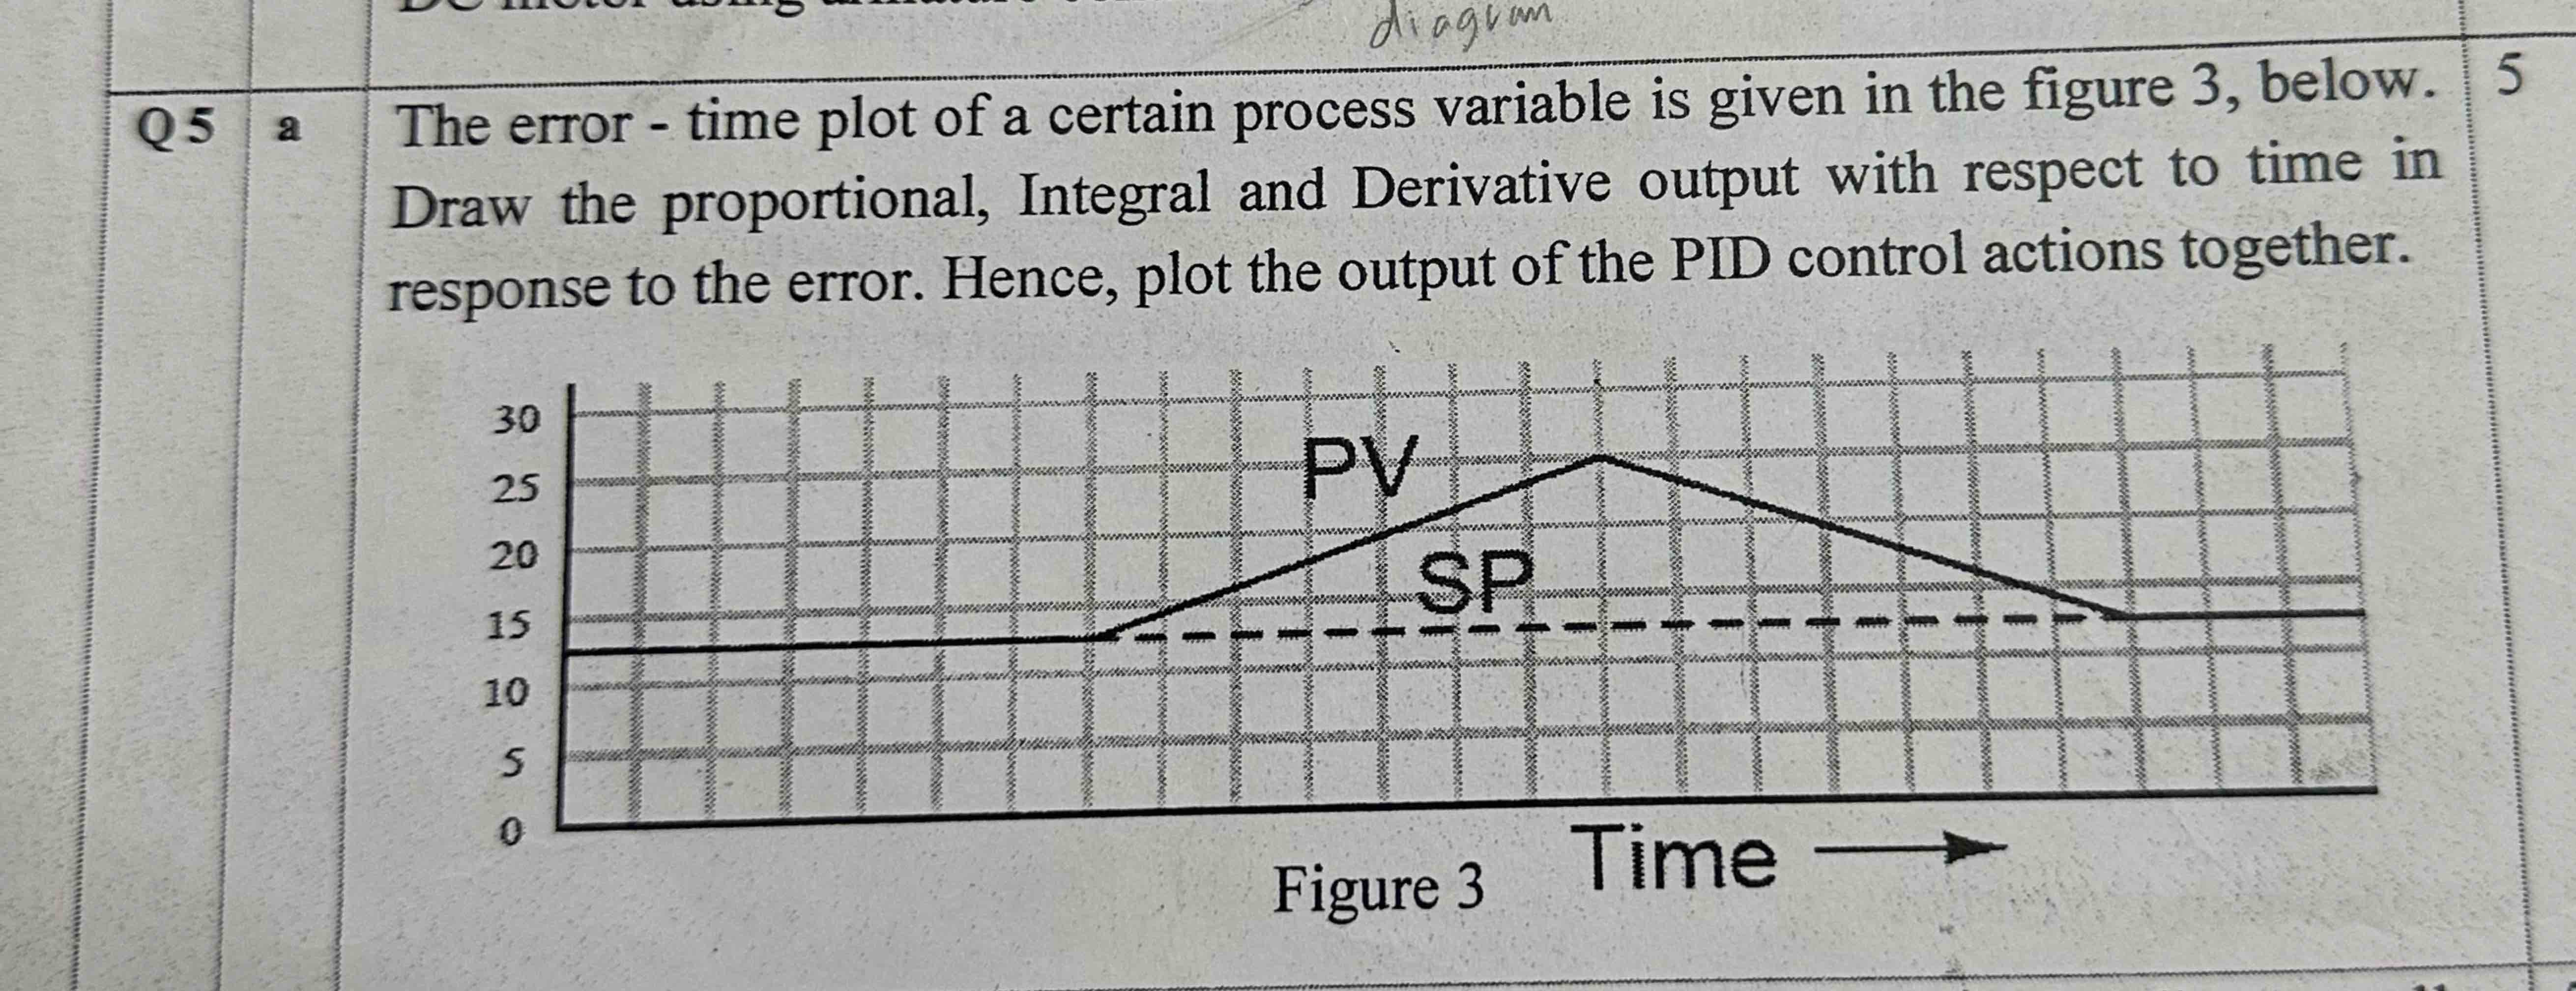
Question: The error - time plot of a certain process variable is given in the figure 3 , below. Draw the proportional, Integral and Derivative output
The error time plot of a certain process variable is given in the figure below. Draw the proportional, Integral and Derivative output with respect to time in response to the error. Hence, plot the output of the PID control actions together.
Step by Step Solution
There are 3 Steps involved in it
1 Expert Approved Answer
Step: 1 Unlock

Question Has Been Solved by an Expert!
Get step-by-step solutions from verified subject matter experts
Step: 2 Unlock
Step: 3 Unlock