

Question: The figure below shows a randomization distribution for 1000 simulated samples for testingH0:p=0.5versusHa:p>0.5. As shown in the figure, we find a p-value of 0.021 for
The figure below shows a randomization distribution for 1000 simulated samples for testingH0:p=0.5versusHa:p>0.5. As shown in the figure, we find a p-value of 0.021 for the observed statistic 0.600. Will the p-value change if we use a two-tail test instead? If so, what is the value of the new p-value?
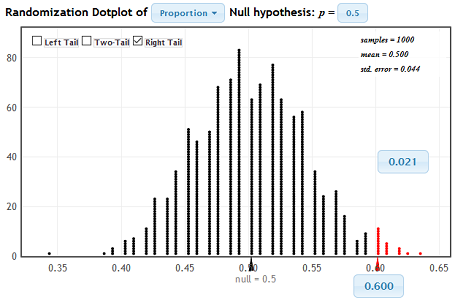
Randomization Dotplot of Proportion Null hypothesis: p = 0.5 Left Tail Two-Tail / Right Tail temple - 1009 80 MPH = 0.505 sed error = 0.044 60 40 0.021 20 0.35 0.40 0.45 0.55 0.65 null - 0.5 0.600
Step by Step Solution
There are 3 Steps involved in it
1 Expert Approved Answer
Step: 1 Unlock

Question Has Been Solved by an Expert!
Get step-by-step solutions from verified subject matter experts
Step: 2 Unlock
Step: 3 Unlock