

Question: The figure below shows demand for a road segment with free access for cars, as well as the average cost of use (red curve)
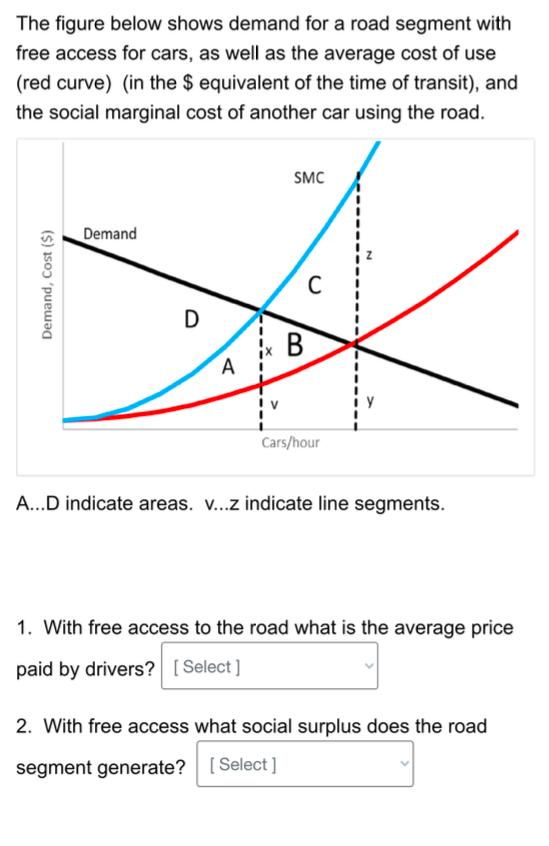
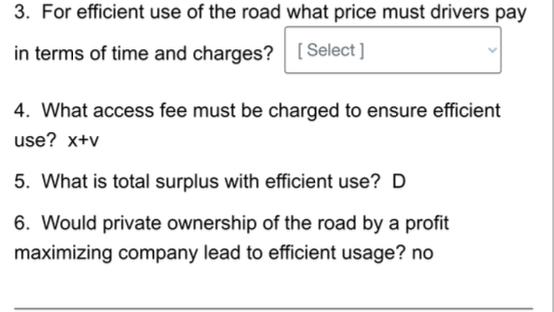
The figure below shows demand for a road segment with free access for cars, as well as the average cost of use (red curve) (in the $ equivalent of the time of transit), and the social marginal cost of another car using the road. Demand, Cost ($) Demand D A SMC C B Cars/hour A...D indicate areas. v...z indicate line segments. 1. With free access to the road what is the average price paid by drivers? [Select] 2. With free access what social surplus does the road segment generate? [Select] 3. For efficient use of the road what price must drivers pay in terms of time and charges? [Select] 4. What access fee must be charged to ensure efficient use? x+v 5. What is total surplus with efficient use? D 6. Would private ownership of the road by a profit maximizing company lead to efficient usage? no
Step by Step Solution
There are 3 Steps involved in it
1in private market equilibrium Demand curve cuts PMC private MC curve this occurs when black line cu... View full answer

Get step-by-step solutions from verified subject matter experts