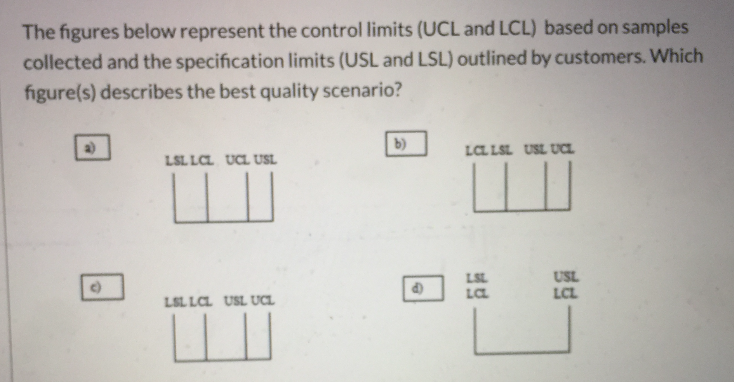
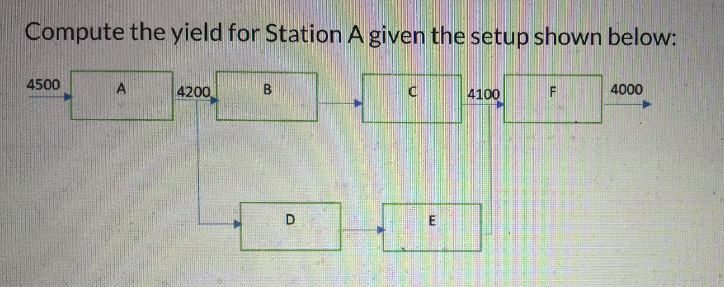
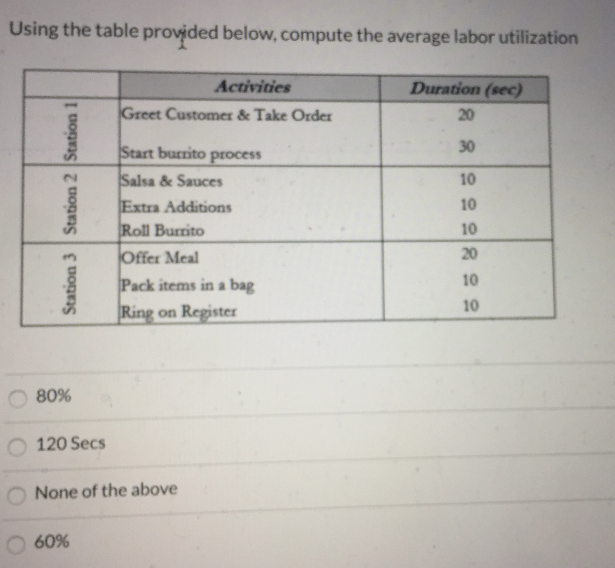
Question: The figures below represent the control limits (UCL and LCL) based on samples collected and the specification limits (USL and LSL) outlined by customers. Which

The figures below represent the control limitsThe figures below represent the control limitsThe figures below represent the control limits

The figures below represent the control limits (UCL and LCL) based on samples collected and the specification limits (USL and LSL) outlined by customers. Which figure(s) describes the best quality scenario?! LSL La UCL USL La LSL USLUGE LSL La USL UCL. Compute the yield for Station A given the setup shown below: 4500 4000 4100 Using the table provided below, compute the average labor utilization Duration (sec) Activities Greet Customer & Take Order Station 2 Station 1 Start burrito process Salsa & Sauces Extra Additions Roll Burrito Offer Meal Pack items in a bag Ring on Register Station 3 80% 120 secs None of the above 60%

Step by Step Solution

There are 3 Steps involved in it

1 Expert Approved Answer
Step: 1 Unlock blur-text-image
Question Has Been Solved by an Expert!

Get step-by-step solutions from verified subject matter experts

Step: 2 Unlock
Step: 3 Unlock

Students Have Also Explored These Related General Management Questions!