

Question: The following are quality control data for a manufacturing process a t Kensport Chemical Company. The data show the temperature i n degrees centigrade a
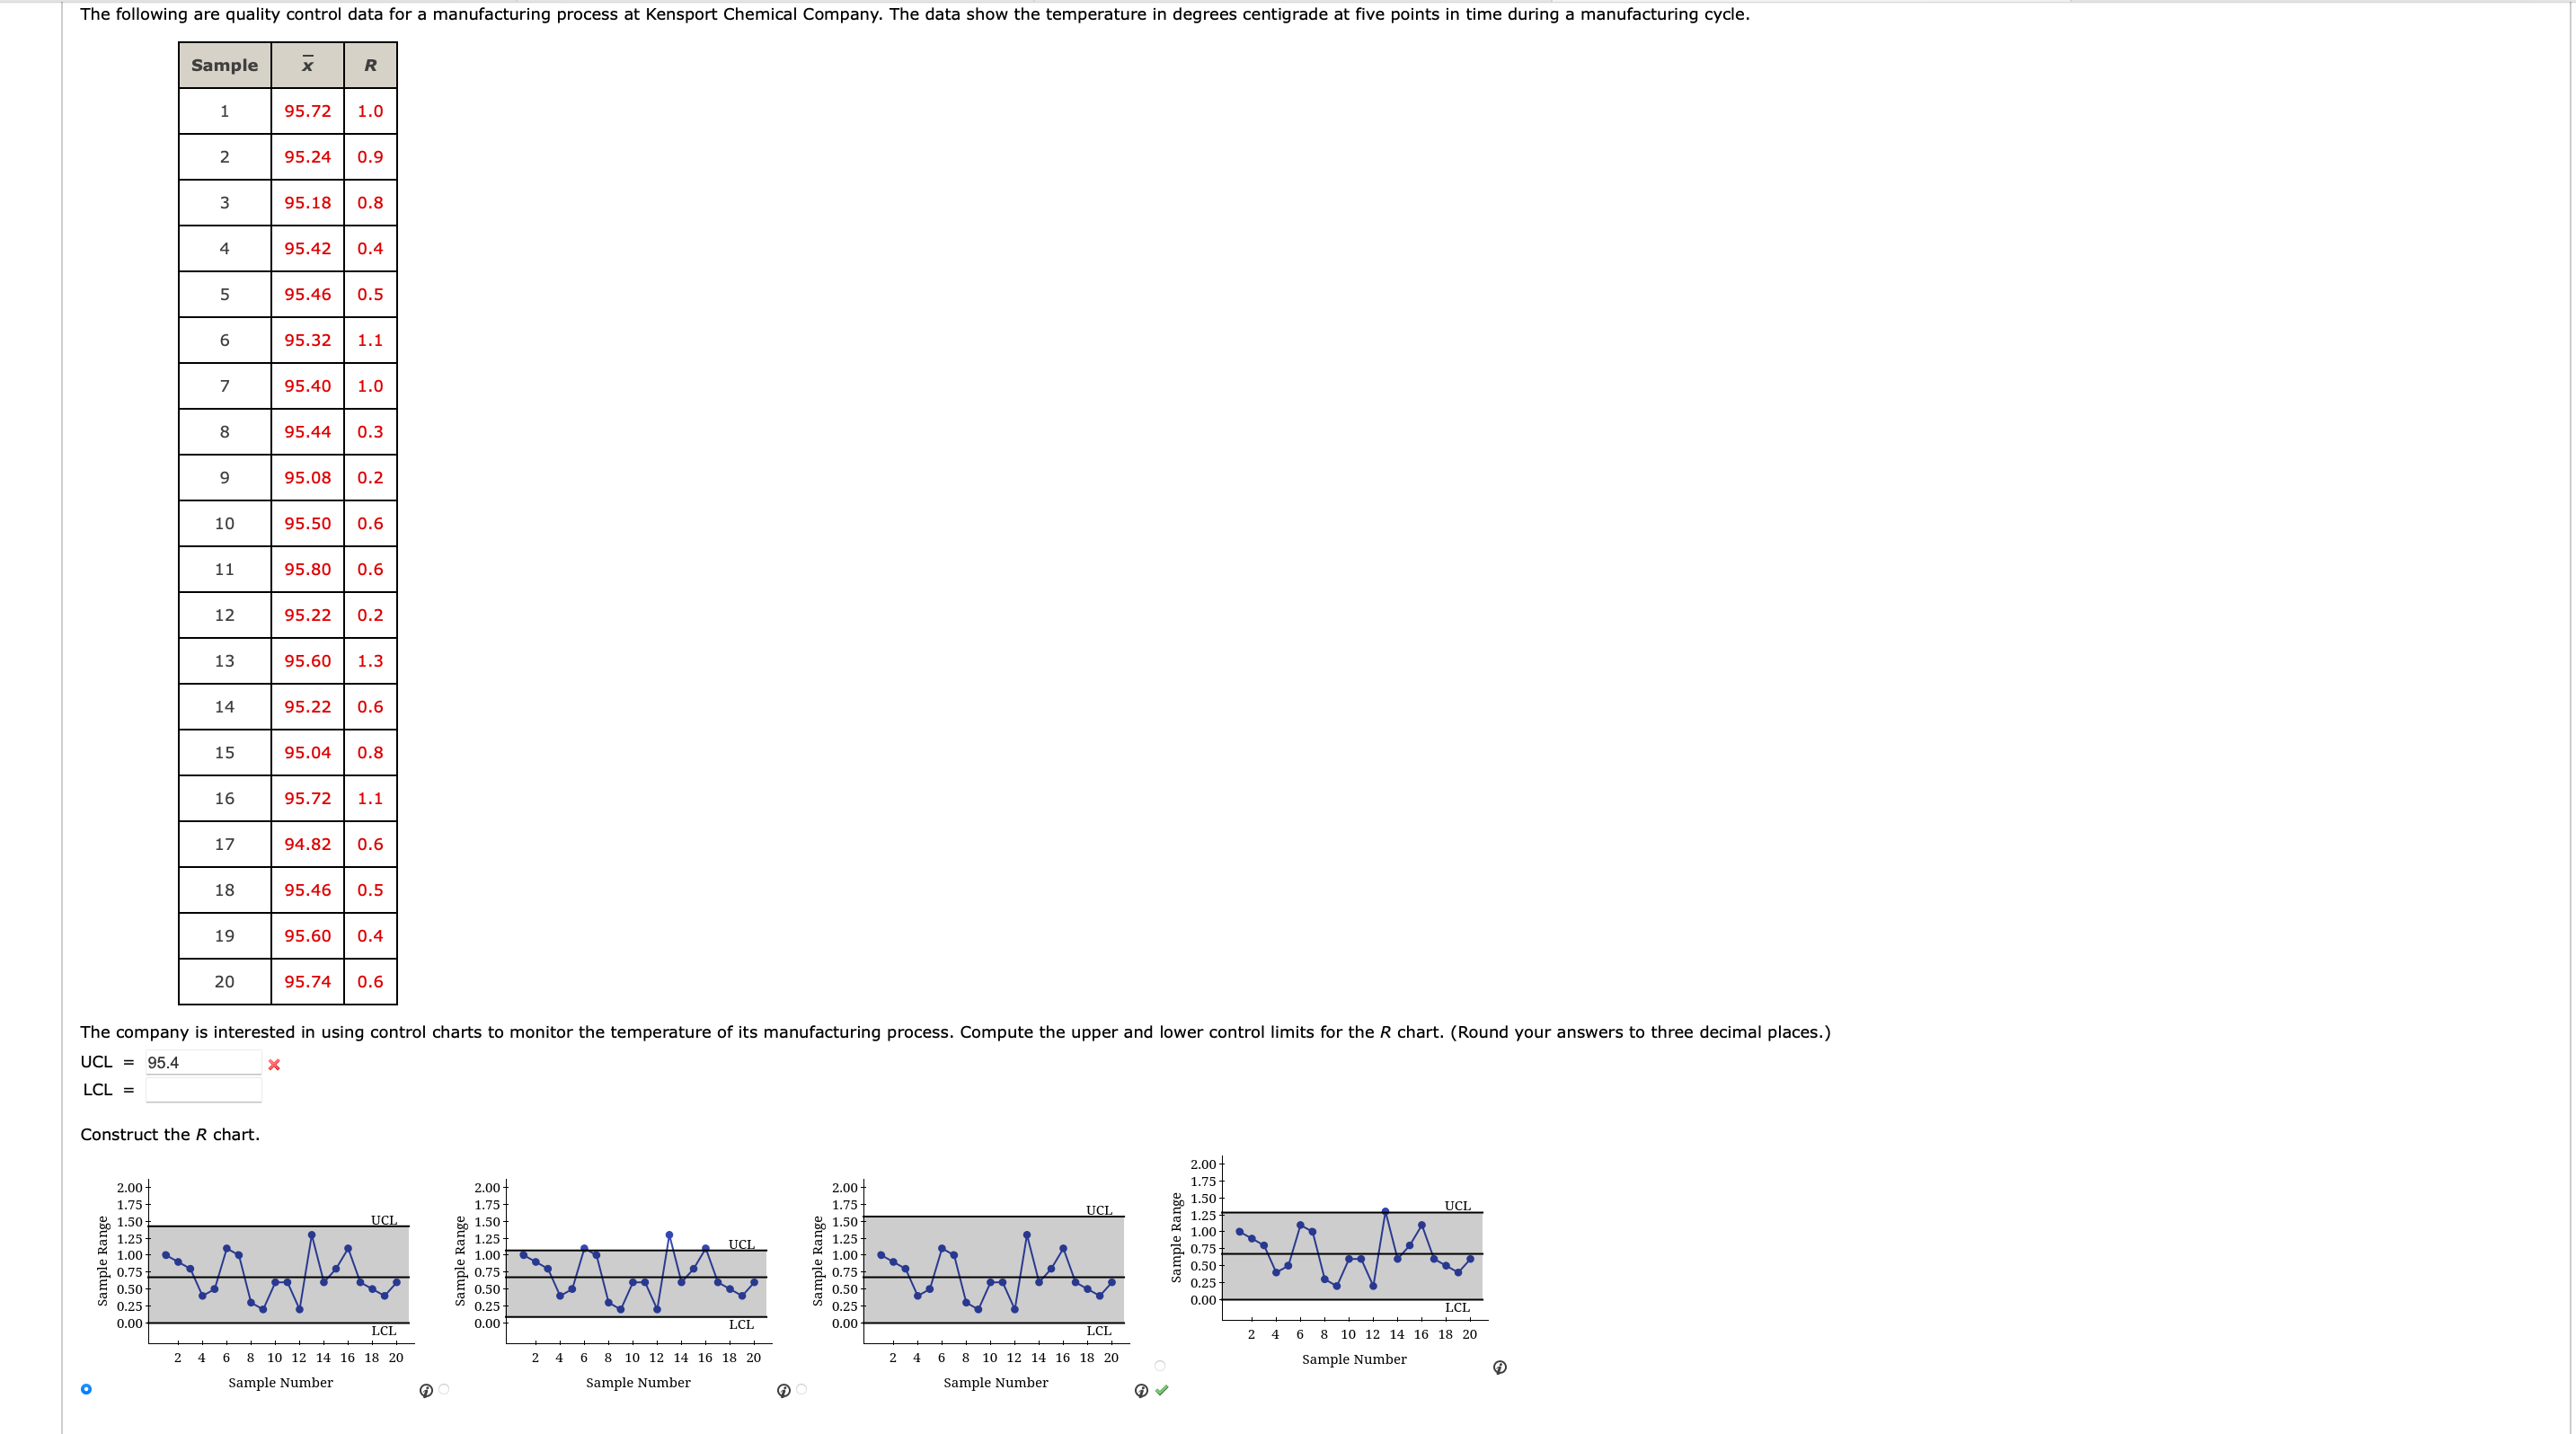
The following are quality control data for a manufacturing process Kensport Chemical Company. The data show the temperature degrees centigrade five points time during a manufacturing cycle.
egin
line Sample & &
& &
& &
& &
& &
& &
& &
& &
& &
& &
& &
& &
& &
& &
& &
& &
& &
& &
& &
& &
& &
UCL
Snnctrint the rhart
UCL
Compute the upper and lower control for the chart. your answers three decimal places.
UCL
What conclusions can made about the quality the process?
The chart indicates that the process variability
samples fall
outside the chart control The chart indicates that the process mean out control hat
One sample falls
outside the chart control
Step by Step Solution
There are 3 Steps involved in it
1 Expert Approved Answer
Step: 1 Unlock

Question Has Been Solved by an Expert!
Get step-by-step solutions from verified subject matter experts
Step: 2 Unlock
Step: 3 Unlock