

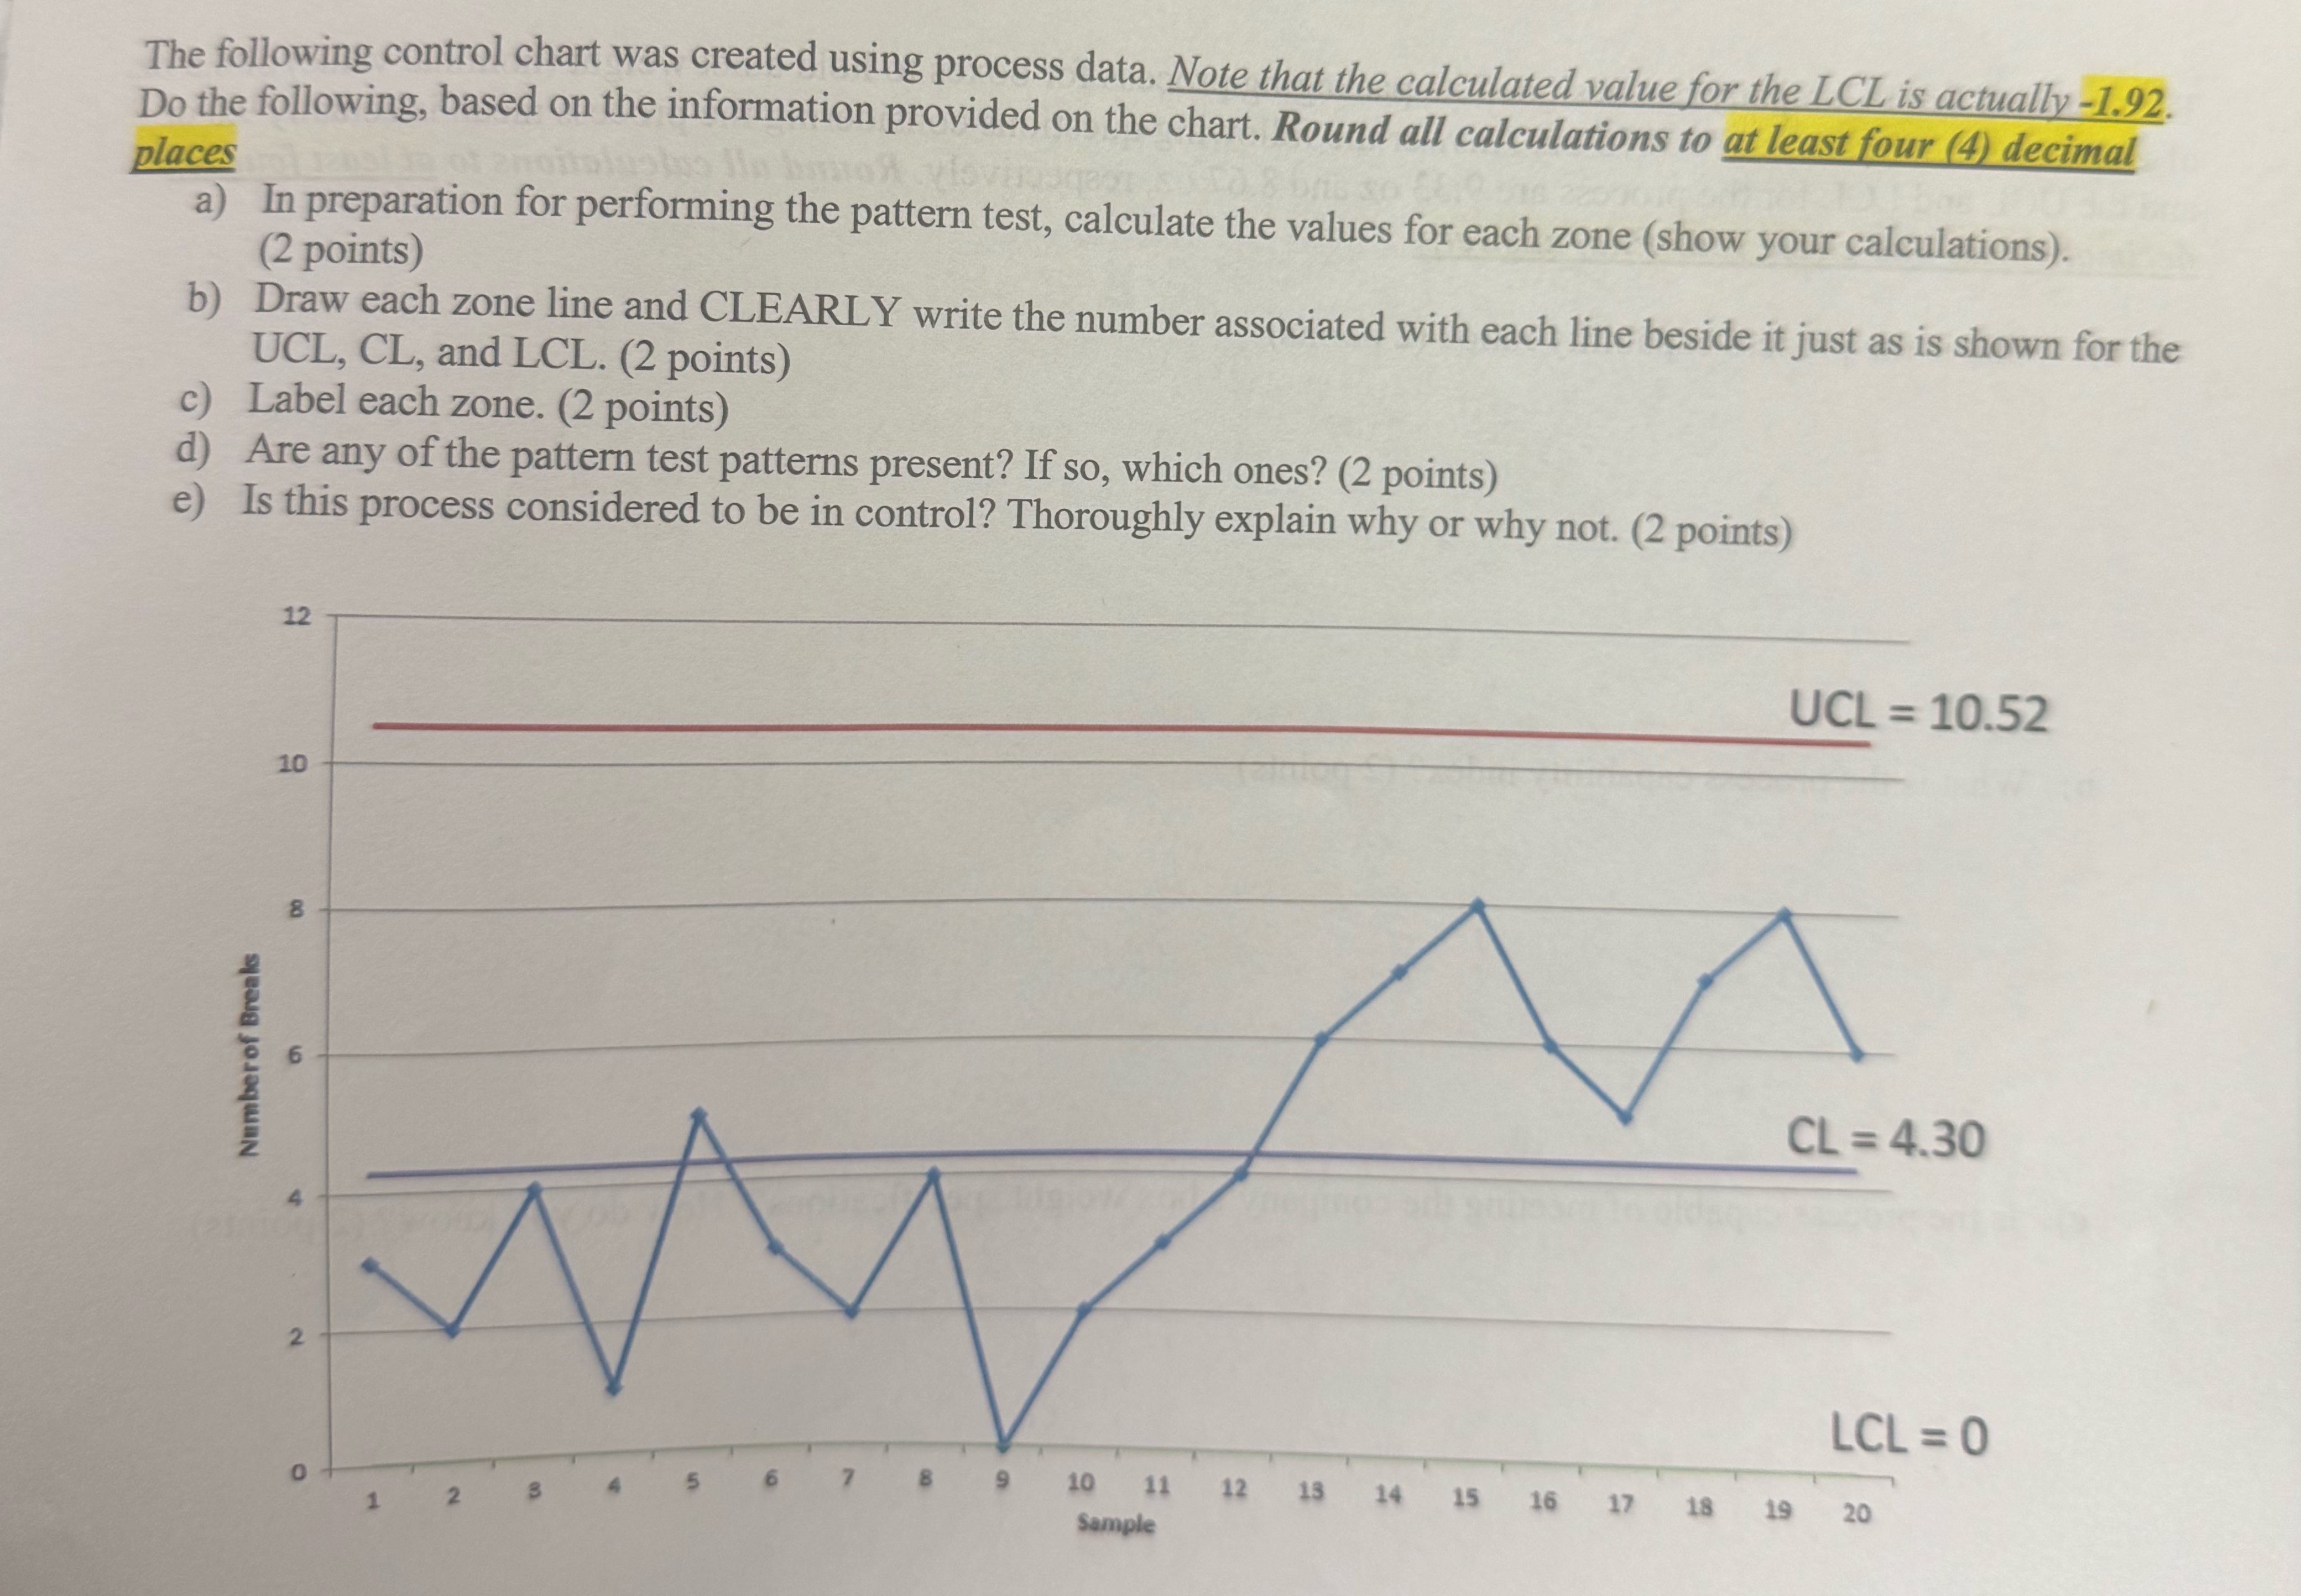
Question: The following control chart was created using process data. Note that the calculated value for the LCL is actually - 1 . 9 2 .
The following control chart was created using process data. Note that the calculated value for the LCL is actually Do the following, based on the information provided on the chart. Round all calculations to at least four decimal places
a In preparation for performing the pattern test, calculate the values for each zone show your calculations points
b Draw each zone line and CLEARLY write the number associated with each line beside it just as is shown for the UCL, CL and LCL points
c Label each zone. points
d Are any of the pattern test patterns present? If so which ones? points
e Is this process considered to be in control? Thoroughly explain why or why not. points
Step by Step Solution
There are 3 Steps involved in it
1 Expert Approved Answer
Step: 1 Unlock

Question Has Been Solved by an Expert!
Get step-by-step solutions from verified subject matter experts
Step: 2 Unlock
Step: 3 Unlock