

Question: The following data are average times per order over the last month. Move time Inspection time Queue time Wait time to start production Process
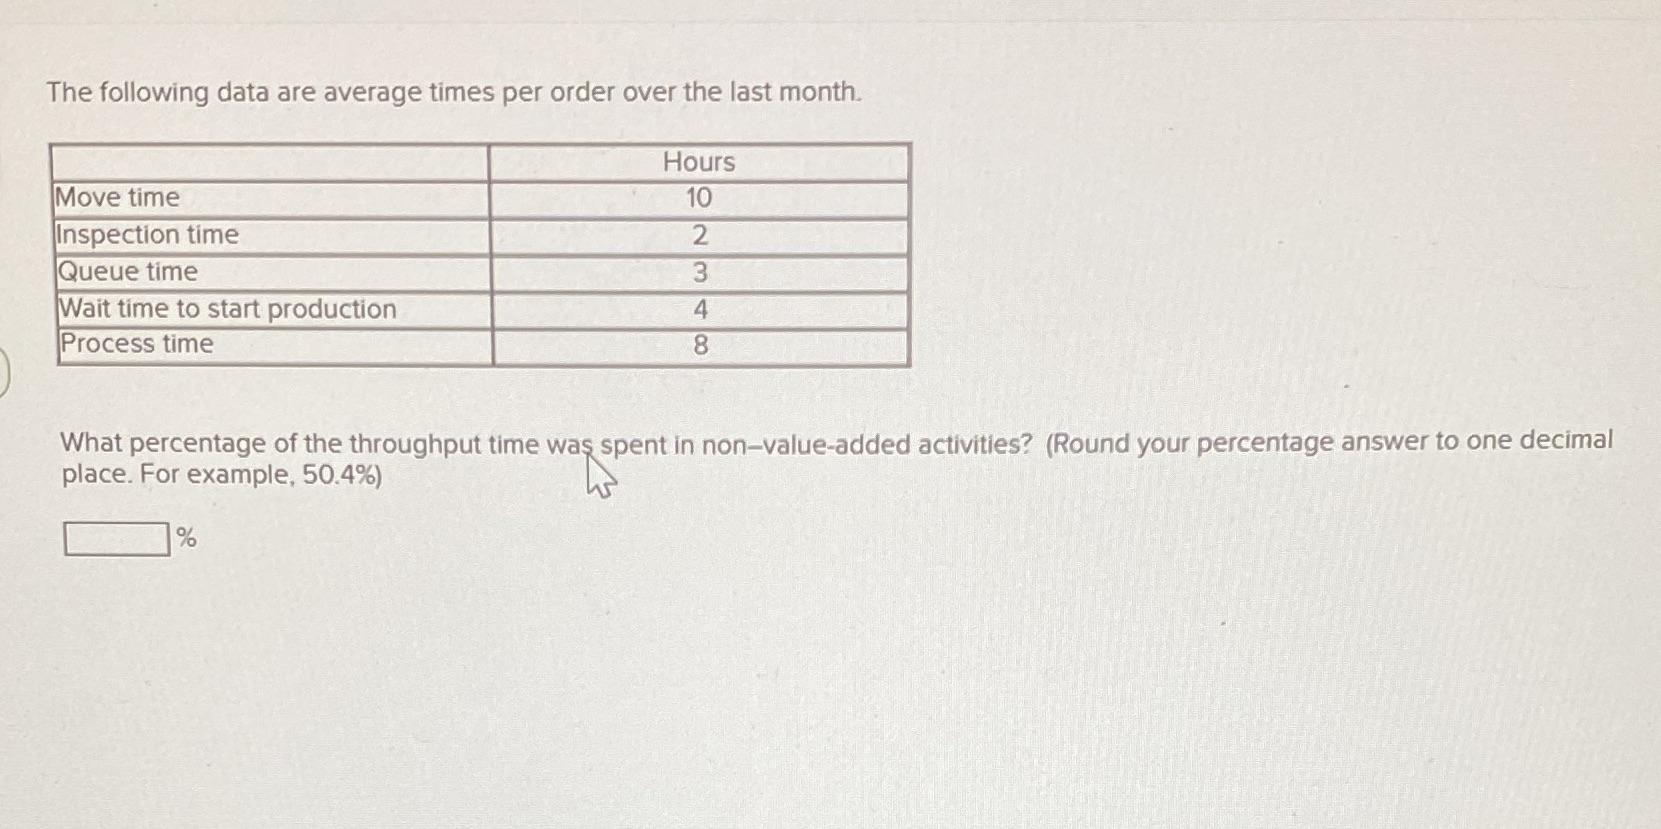
The following data are average times per order over the last month. Move time Inspection time Queue time Wait time to start production Process time Hours 10 2 3 4 8 What percentage of the throughput time was spent in non-value-added activities? (Round your percentage answer to one decimal place. For example, 50.4%) %
Step by Step Solution
There are 3 Steps involved in it
1 Expert Approved Answer
Step: 1 Unlock

Question Has Been Solved by an Expert!
Get step-by-step solutions from verified subject matter experts
Step: 2 Unlock
Step: 3 Unlock