

Question: The following graph input tool shows the marginal benefit ( M B ) and marginal cost ( M C ) curves for baseballs in an
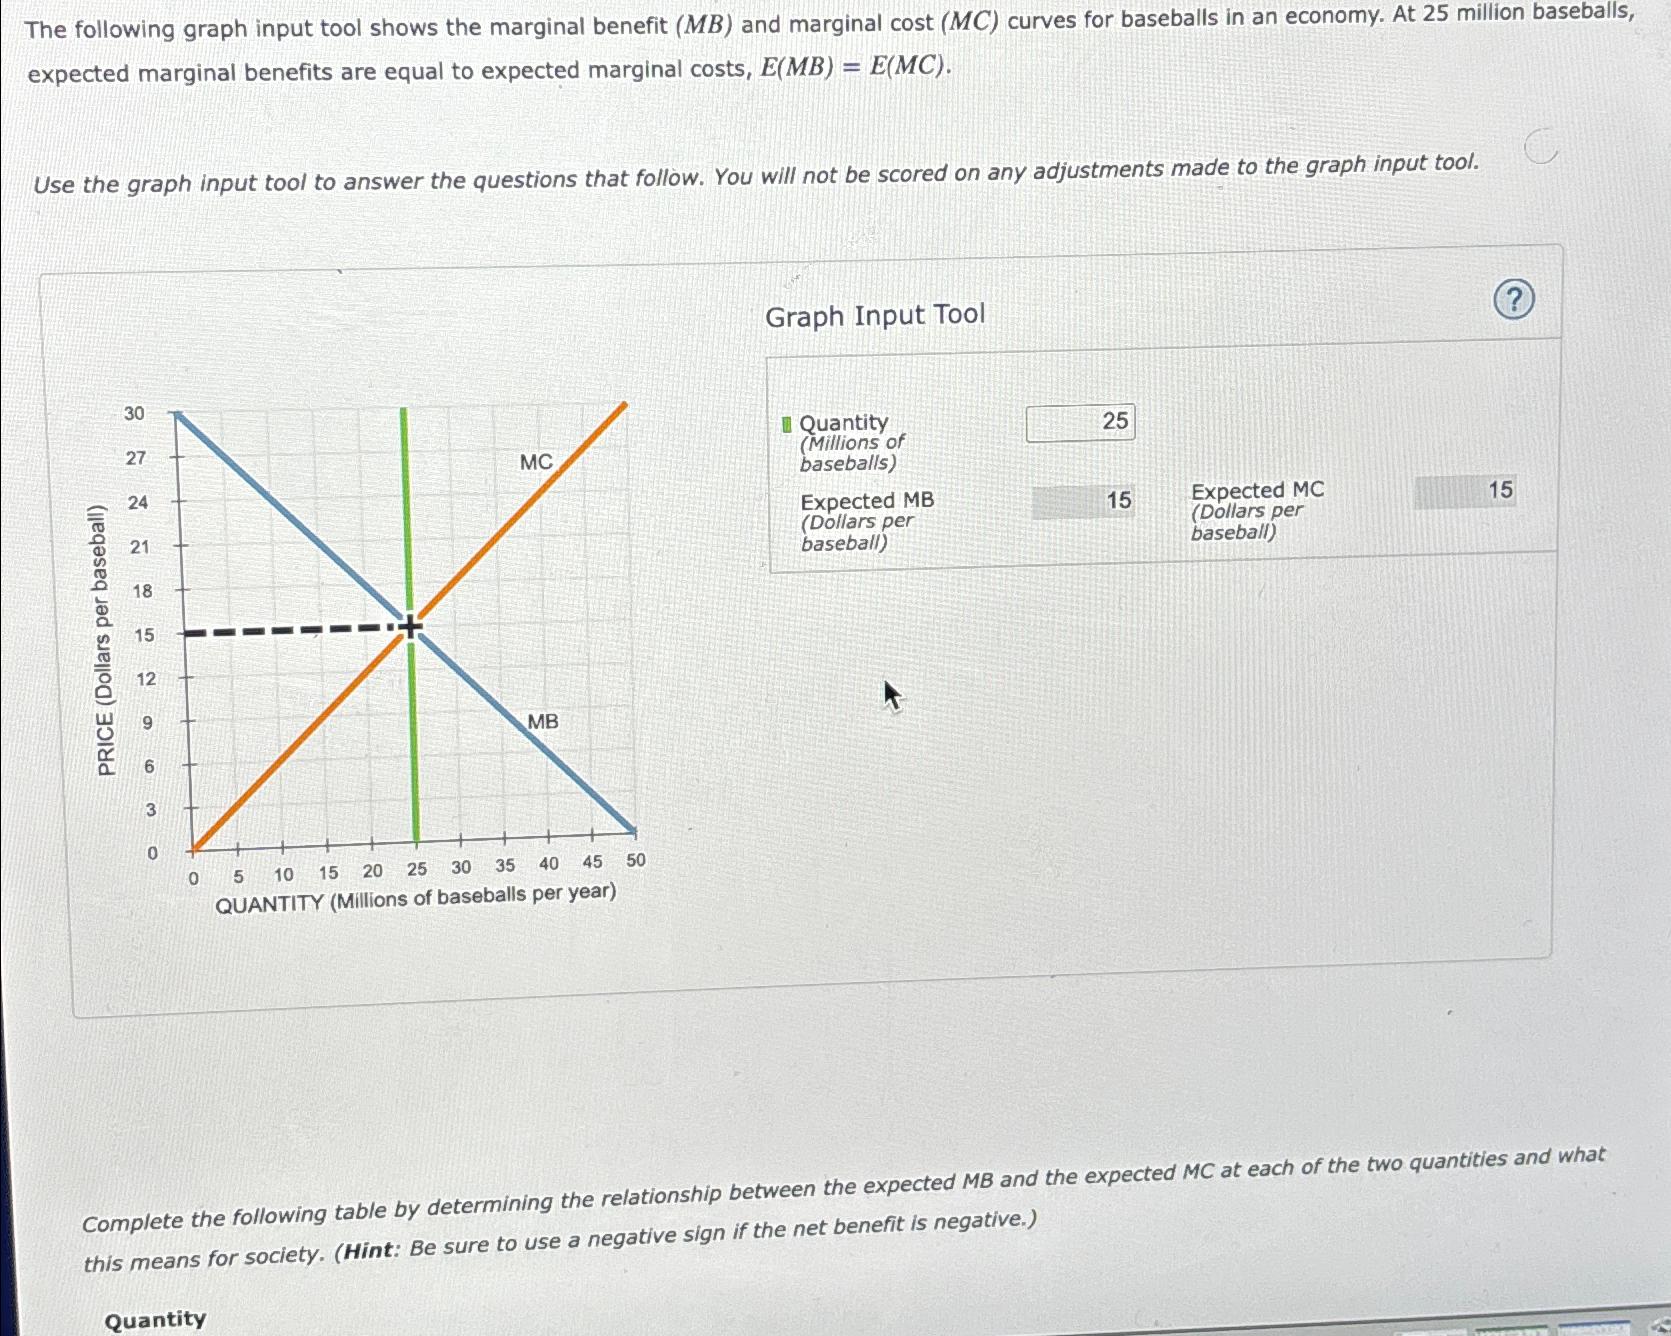
The following graph input tool shows the marginal benefit and marginal cost curves for baseballs in an economy. At million baseballs, expected marginal benefits are equal to expected marginal costs,
Use the graph input tool to answer the questions that follow. You will not be scored on any adjustments made to the graph input tool.
Graph Input Tool
Quantity Millions of baseballs
Expected MB
Dollars per baseball
Expected MC
Dollars per baseball
Complete the following table by determining the relationship between the expected MB and the expected MC at each of the two quantities and what this means for society. Hint: Be sure to use a negative sign if the net benefit is negative.
Quantity
Step by Step Solution
There are 3 Steps involved in it
1 Expert Approved Answer
Step: 1 Unlock

Question Has Been Solved by an Expert!
Get step-by-step solutions from verified subject matter experts
Step: 2 Unlock
Step: 3 Unlock