

Question: The following graph shows an increase in aggregate demand (AD) in a hypothetical country. Specifically, aggregate demand shifts to the right from AD1AD1to AD2AD2, causing
The following graph shows an increase in aggregate demand (AD) in a hypothetical country. Specifically, aggregate demand shifts to the right from AD1AD1to AD2AD2, causing the quantity of output demanded to rise at all price levels. For example, at a price level of 140, output is now $400 billion, where previously it was $300 billion.
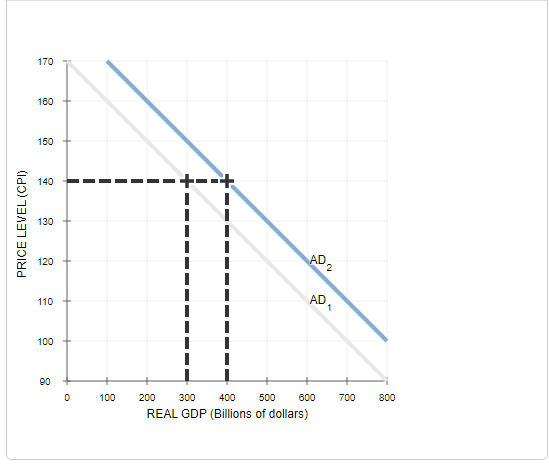
170 160 150 140 130 PRICE LEVEL (CPI) 120 ADZ 110 AD 100 80 100 200 300 400 500 600 700 800 REAL GDP (Billions of dollars)
Step by Step Solution
There are 3 Steps involved in it
1 Expert Approved Answer
Step: 1 Unlock

Question Has Been Solved by an Expert!
Get step-by-step solutions from verified subject matter experts
Step: 2 Unlock
Step: 3 Unlock