

Question: The following graphs are derived using CAPM method based on price information of ATET and Verizon from Jan 31, 2019 to Jan 30, 2020 from
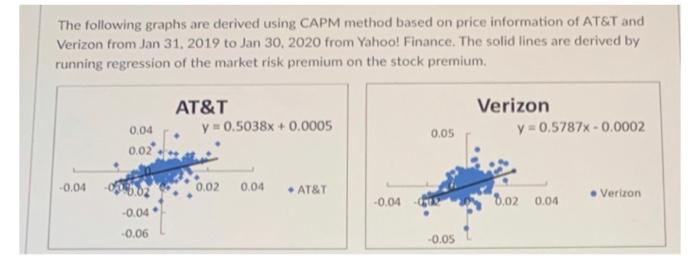

The following graphs are derived using CAPM method based on price information of ATET and Verizon from Jan 31, 2019 to Jan 30, 2020 from Yahoo! Finance. The solid lines are derived by running regression of the market risk premium on the stock premium. Based on the information of Question 18 , use market neutral and pair trading strategy, and the two stocks alpha and raw beta values, decide how to allocate your wealth on these two stocks to achieve a successful market neutral portfolio. Please show all your work
Step by Step Solution
There are 3 Steps involved in it
1 Expert Approved Answer
Step: 1 Unlock

Question Has Been Solved by an Expert!
Get step-by-step solutions from verified subject matter experts
Step: 2 Unlock
Step: 3 Unlock