

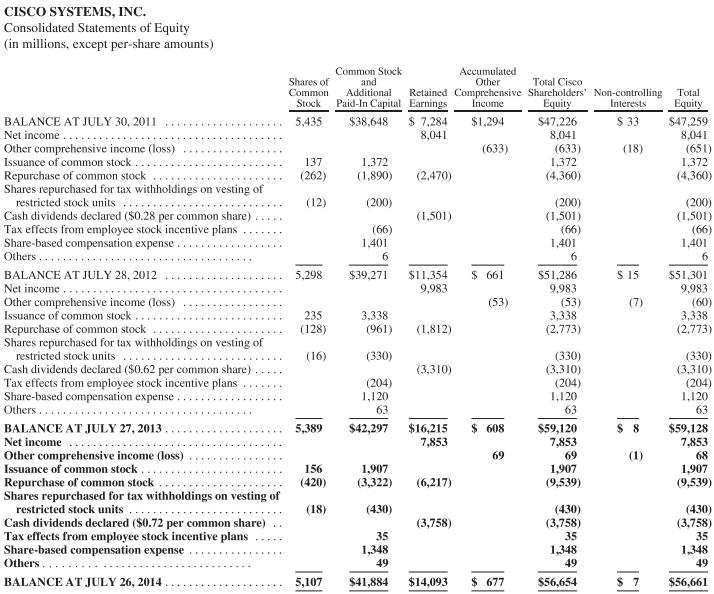
The following question pertains to the 420 million shares that Cisco purchased during fiscal year 2014....
Fantastic news! We've Found the answer you've been seeking!
Question:
Transcribed Image Text:
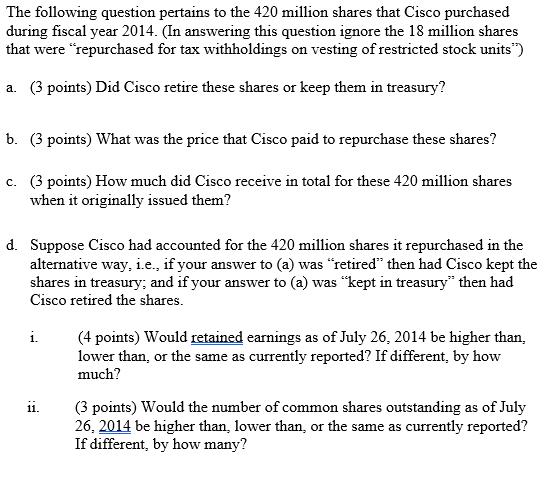
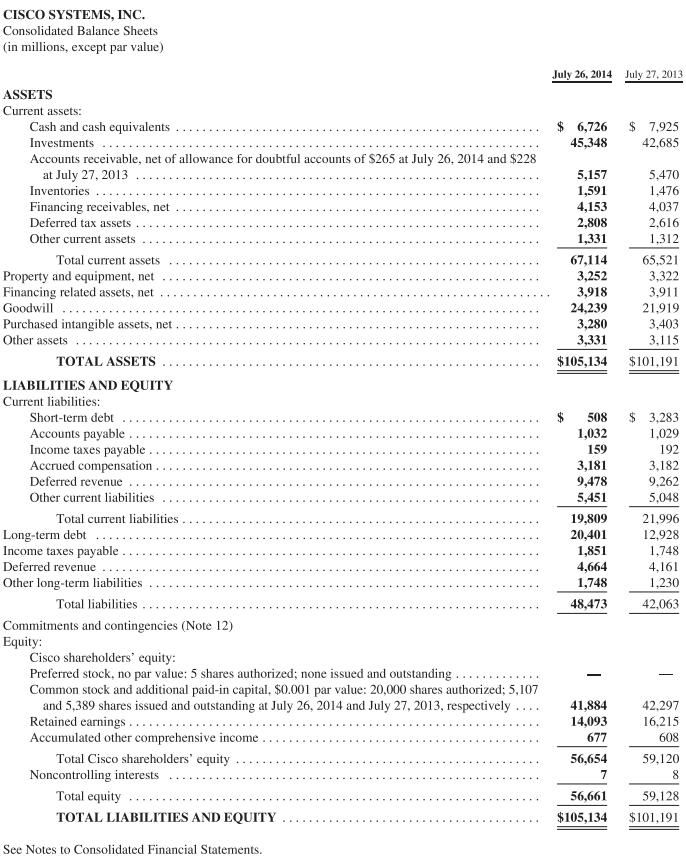
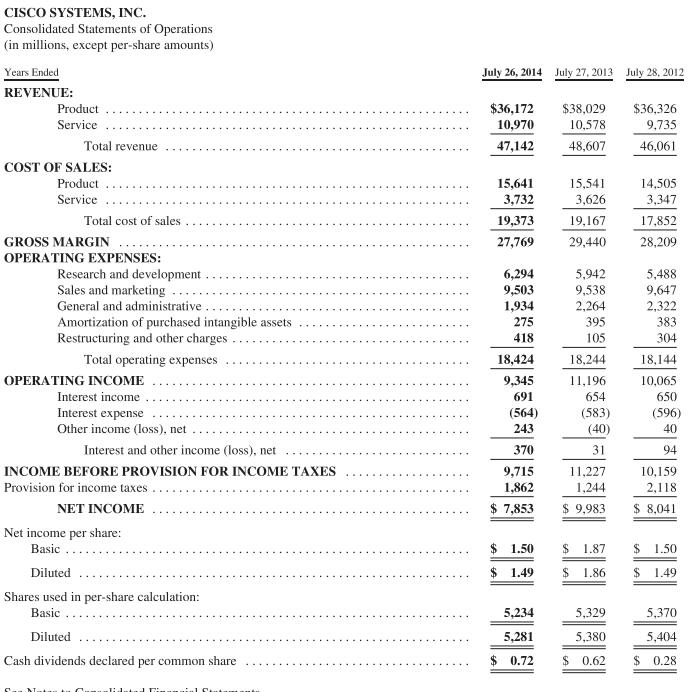
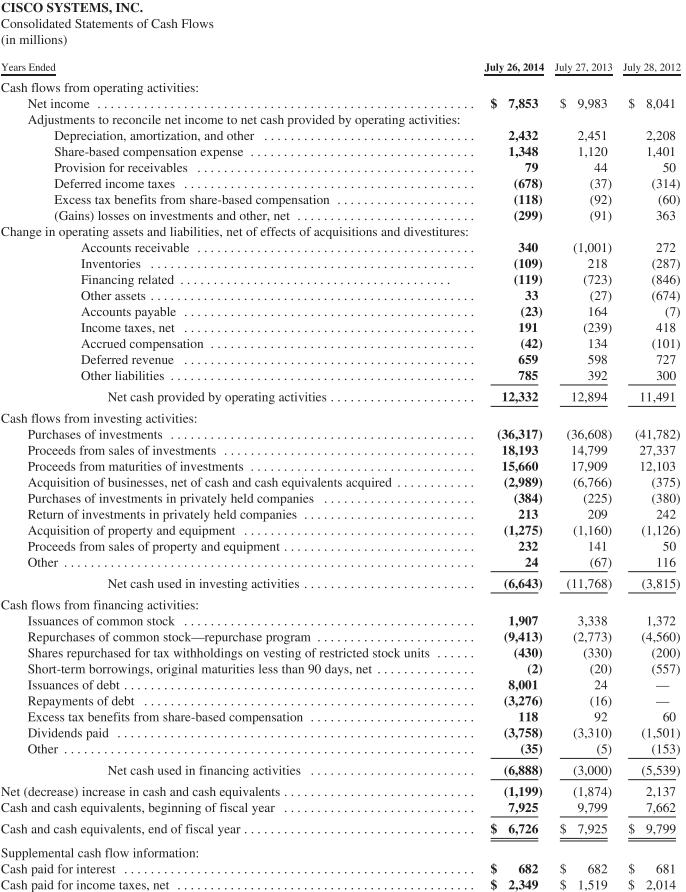
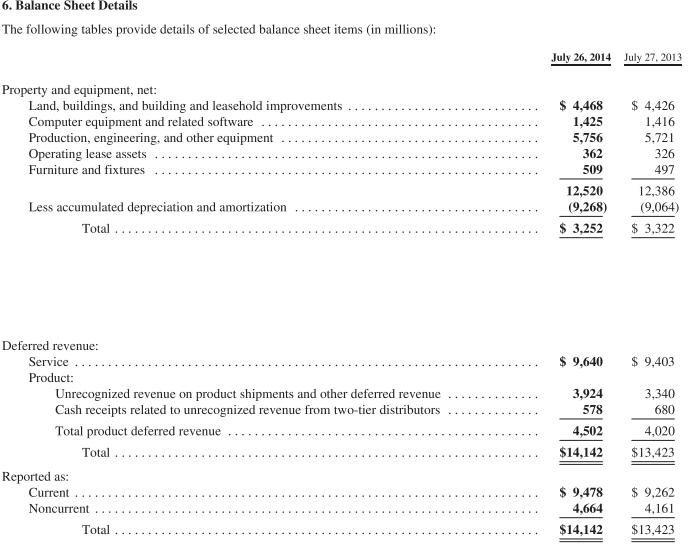
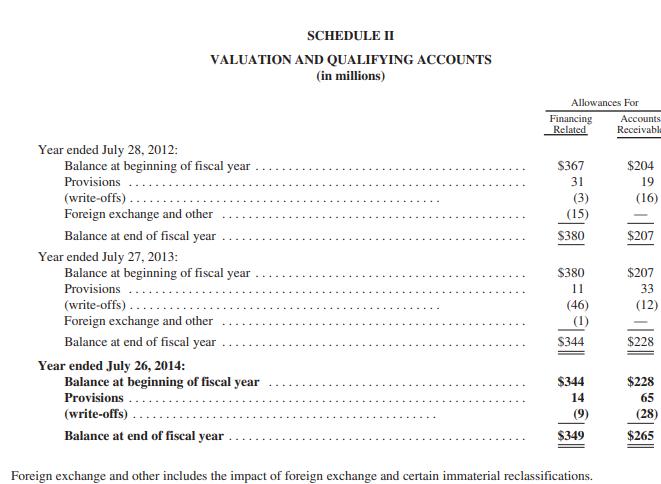
The following question pertains to the 420 million shares that Cisco purchased during fiscal year 2014. (In answering this question ignore the 18 million shares that were "repurchased for tax withholdings on vesting of restricted stock units") a. (3 points) Did Cisco retire these shares or keep them in treasury? b. (3 points) What was the price that Cisco paid to repurchase these shares? c. (3 points) How much did Cisco receive in total for these 420 million shares when it originally issued them? d. Suppose Cisco had accounted for the 420 million shares it repurchased in the alternative way, i.e., if your answer to (a) was "retired" then had Cisco kept the shares in treasury; and if your answer to (a) was "kept in treasury" then had Cisco retired the shares. i. 11. (4 points) Would retained earnings as of July 26, 2014 be higher than, lower than, or the same as currently reported? If different, by how much? (3 points) Would the number of common shares outstanding as of July 26, 2014 be higher than, lower than, or the same as currently reported? If different, by how many? CISCO SYSTEMS, INC. Consolidated Balance Sheets (in millions, except par value) ASSETS Current assets: Cash and cash equivalents Investments Accounts receivable, net of allowance for doubtful accounts of $265 at July 26, 2014 and $228 at July 27, 2013 Inventories Financing receivables, net Deferred tax assets Other current assets Total current assets Property and equipment, net Financing related assets, net Goodwill Purchased intangible assets, net. Other assets TOTAL ASSETS LIABILITIES AND EQUITY Current liabilities: Short-term debt Accounts payable. Income taxes payable. Accrued compensation. Deferred revenue Other current liabilities Total current liabilities Long-term debt Income taxes payable. Deferred revenue Other long-term liabilities Total liabilities Commitments and contingencies (Note 12) Equity: Cisco shareholders' equity: Preferred stock, no par value: 5 shares authorized; none issued and outstanding.. Common stock and additional paid-in capital, $0.001 par value: 20,000 shares authorized; 5,107 and 5,389 shares issued and outstanding at July 26, 2014 and July 27, 2013, respectively Retained earnings..... Accumulated other comprehensive income Total Cisco shareholders' equity Noncontrolling interests Total equity TOTAL LIABILITIES AND EQUITY See Notes to Consolidated Financial Statements. July 26, 2014 July 27, 2013 6,726 45,348 5,157 1,591 4,153 2,808 1,331 67,114 3,252 3,918 24,239 3,280 3,331 $105,134 508 1,032 159 3,181 9,478 5,451 19,809 20,401 1,851 4,664 1,748 48,473 41,884 14,093 677 56,654 7 $ 7,925 42,685 5,470 1,476 4,037 2,616 1,312 65,521 3,322 3,911 21,919 3,403 3,115 $101,191 $3,283 1,029 192 3,182 9,262 5,048 21,996 12,928 1,748 4,161 1,230 42,063 - 42,297 16,215 608 59,120 8 56,661 59,128 $105,134 $101,191 CISCO SYSTEMS, INC. Consolidated Statements of Operations (in millions, except per-share amounts) Years Ended REVENUE: Product Service Total revenue COST OF SALES: Product Service Total cost of sales GROSS MARGIN OPERATING EXPENSES: Research and development. Sales and marketing General and administrative. Amortization of purchased intangible assets Restructuring and other charges Total operating expenses OPERATING INCOME Interest income Interest expense Other income (loss), net Interest and other income (loss), net INCOME BEFORE PROVISION FOR INCOME TAXES Provision for income taxes NET INCOME Net income per share: Basic... Diluted Shares used in per-share calculation: Basic. Diluted Cash dividends declared per common share July 26, 2014 July 27, 2013 July 28, 2012 $36,172 10,970 47,142 15,641 3,732 19,373 27,769 6,294 9,503 1,934 275 418 18,424 9,345 691 (564) 243 370 9,715 1,862 $ 7,853 $ 1.50 $1.49 5,234 5,281 $ 0.72 $38,029 10,578 48,607 15,541 3,626 19,167 29,440 5,942 9,538 2,264 395 105 18,244 11,196 654 (583) (40) 31 11,227 1,244 $ 9,983 $ 1.87 $ 1.86 5,329 5,380 $ 0.62 $36,326 9,735 46,061 14,505 3,347 17,852 28,209 5,488 9,647 2,322 383 304 18,144 10,065 650 (596) 40 94 10,159 2,118. $ 8,041 $ 1.50 $ 1.49 5,370 5,404 $ 0.28 CISCO SYSTEMS, INC. Consolidated Statements of Cash Flows (in millions) Years Ended Cash flows from operating activities: Net income Adjustments to reconcile net income to net cash provided by operating activities: Depreciation, amortization, and other Share-based compensation expense Provision for receivables Deferred income taxes Excess tax benefits from share-based compensation (Gains) losses on investments and other, net Change in operating assets and liabilities, net of effects of acquisitions and divestitures: Accounts receivable Inventories Financing related Other assets Accounts payable Income taxes, net Accrued compensation Deferred revenue Other liabilities Net cash provided by operating activities. Cash flows from investing activities: Purchases of investments Proceeds from sales of investments Proceeds from maturities of investments Acquisition of businesses, net of cash and cash equivalents acquired Purchases of investments in privately held companies Return of investments in privately held companies Acquisition of property and equipment Proceeds from sales of property and equipment Other.... Net cash used in investing activities Cash flows from financing activities: Issuances of common stock Repurchases of common stock-repurchase program Shares repurchased for tax withholdings on vesting of restricted stock units Short-term borrowings, original maturities less than 90 days, net Issuances of debt.. Repayments of debt Excess tax benefits from share-based compensation Dividends paid Other Net cash used in financing activities Net (decrease) increase in cash and cash equivalents. Cash and cash equivalents, beginning of fiscal year Cash and cash equivalents, end of fiscal year. Supplemental cash flow information: Cash paid for interest Cash paid for income taxes, net July 26, 2014 July 27, 2013 July 28, 2012 $ 7,853 2,432 1,348 79 (678) (118) (299) 340 (109) (119) 33 (23) 191 (42) 659 785 12,332 (1,275) 232 24 (6,643) $ 9,983 2,451 1,120 44 (37) (92) (91) 1,907 (9,413) (430) (2) (1,001) 218 (723) (27) 164 (36,317) (36,608) 18,193 14,799 15,660 17,909 (2,989) (6,766) (384) (225) 213 209 (239) 134 598 392 12,894 (1,160) 141 (67) (11,768) 3,338 (2,773) (330) (20) 24 8,001 (3,276) 118 (3,758) (35) (6,888) (3,000) (1,874) (1,199) 7,925 9,799 $ 6,726 $ 7,925 (16) 92 (3,310) (5) $ 682 $ 682 $ 2,349 $ 1,519 $8,041 2,208 1,401 50 (314) (60) 363 272 (287) (846) (674) (7) 418 (101) 727 300 11,491 (41,782) 27,337 12,103 (375) (380) 242 (1,126) 50 116 (3,815) 1,372 (4,560) (200) (557) 60 (1,501) (153) (5,539) 2,137 7,662 $ 9,799 681 $ 2,014 CISCO SYSTEMS, INC. Consolidated Statements of Equity (in millions, except per-share amounts) BALANCE AT JULY 30, 2011 Net income Other comprehensive income (loss) Issuance of common stock. Repurchase of common stock Shares repurchased for tax withholdings on vesting of restricted stock units Cash dividends declared ($0.28 per common share) Tax effects from employee stock incentive plans Share-based compensation expense Others... BALANCE AT JULY 28, 2012 Net income Other comprehensive income (loss) Issuance of common stock. Repurchase of common stock Shares repurchased for tax withholdings on vesting of restricted stock units Cash dividends declared ($0.62 per common share) Tax effects from employee stock incentive plans Share-based compensation expense.. Others. BALANCE AT JULY 27, 2013 Net income Other comprehensive income (loss) Issuance of common stock Repurchase of common stock Shares repurchased for tax withholdings on vesting of restricted stock units Cash dividends declared ($0.72 per common share) Tax effects from employee stock incentive plans Share-based compensation expense Others... BALANCE AT JULY 26, 2014 Common Stock Accumulated Other Shares of Common and Total Cisco Additional Retained Comprehensive Shareholders' Non-controlling Total Stock Paid-In Capital Earnings Income Equity Interests Equity 5,435 $38,648 $1,294 $ 33 (18) 137 (262) (12) 5,298 235 (128) (16) 5,389 156 (420) (18) 5,107 1,372 (1,890) (200) (66) 1,401 6 $39,271 3,338 (961) (330) (204) 1,120 63 $42,297 1,907 (3,322) (430) 35 1,348 49 $41,884 $ 7,284 8,041 (2,470) (1,501) $11,354 9,983 (1,812) (3,310) (6,217) (3,758) (633) $16,215 $ 608 7,853 $14,093 $ 661 (53) 69 $ 677 $47,226 8,041 (633) 1,372 (4,360) (200) (1,501) (66) 1,401 6 $51,286 9,983 (53) 3,338 (2,773) (330) (3,310) (204) 1,120 63 $59,120 7,853 69 1,907 (9,539) (430) (3,758) 35 1,348 49 $56,654 $ 15 (7) $8 (1) $7 $47,259 8,041 (651) 1,372 (4,360) (200) (1,501) (66) 1,401 6 $51,301 9,983 (60) 3,338 (2,773) (330) (3,310) (204) 1,120 63 $59,128 7,853 68 1,907 (9,539) (430) (3,758) 35 1,348 49 $56,661 6. Balance Sheet Details The following tables provide details of selected balance sheet items (in millions): Property and equipment, net: Land, buildings, and building and leasehold improvements Computer equipment and related software Production, engineering, and other equipment Operating lease assets Furniture and fixtures Less accumulated depreciation and amortization Total.. Deferred revenue: Service Product: Unrecognized revenue on product shipments and other deferred revenue Cash receipts related to unrecognized revenue from two-tier distributors Total product deferred revenue Total Reported as: Current Noncurrent Total July 26, 2014 July 27, 2013 $ 4,468 1,425 5,756 362 509 12,520 (9,268) 3,252 $ 9,640 3,924 578 4,502 $14,142 $ 4,426 1,416 5,721 326 497 12,386 (9,064) $ 3,322 $ 9,403 3,340 680 4,020 $13,423 $ 9,478 4,664 $ 9,262 4,161 $14,142 $13,423 Year ended July 28, 2012: Balance at beginning of fiscal year Provisions (write-offs).. SCHEDULE II VALUATION AND QUALIFYING ACCOUNTS (in millions) Foreign exchange and other Balance at end of fiscal year Year ended July 27, 2013: Balance at beginning of fiscal year Provisions (write-offs).. Foreign exchange and other Balance at end of fiscal year Year ended July 26, 2014: Balance at beginning of fiscal year Provisions... (write-offs) Balance at end of fiscal year Allowances For Financing Accounts Related Receivable $367 31 (3) (15) $380 $380 11 (46) (1) $344 $344 14 (9) $349 Foreign exchange and other includes the impact of foreign exchange and certain immaterial reclassifications. $204 19 (16) $207 $207 33 (12) $228 $228 65 (28) $265 The following question pertains to the 420 million shares that Cisco purchased during fiscal year 2014. (In answering this question ignore the 18 million shares that were "repurchased for tax withholdings on vesting of restricted stock units") a. (3 points) Did Cisco retire these shares or keep them in treasury? b. (3 points) What was the price that Cisco paid to repurchase these shares? c. (3 points) How much did Cisco receive in total for these 420 million shares when it originally issued them? d. Suppose Cisco had accounted for the 420 million shares it repurchased in the alternative way, i.e., if your answer to (a) was "retired" then had Cisco kept the shares in treasury; and if your answer to (a) was "kept in treasury" then had Cisco retired the shares. i. 11. (4 points) Would retained earnings as of July 26, 2014 be higher than, lower than, or the same as currently reported? If different, by how much? (3 points) Would the number of common shares outstanding as of July 26, 2014 be higher than, lower than, or the same as currently reported? If different, by how many? CISCO SYSTEMS, INC. Consolidated Balance Sheets (in millions, except par value) ASSETS Current assets: Cash and cash equivalents Investments Accounts receivable, net of allowance for doubtful accounts of $265 at July 26, 2014 and $228 at July 27, 2013 Inventories Financing receivables, net Deferred tax assets Other current assets Total current assets Property and equipment, net Financing related assets, net Goodwill Purchased intangible assets, net. Other assets TOTAL ASSETS LIABILITIES AND EQUITY Current liabilities: Short-term debt Accounts payable. Income taxes payable. Accrued compensation. Deferred revenue Other current liabilities Total current liabilities Long-term debt Income taxes payable. Deferred revenue Other long-term liabilities Total liabilities Commitments and contingencies (Note 12) Equity: Cisco shareholders' equity: Preferred stock, no par value: 5 shares authorized; none issued and outstanding.. Common stock and additional paid-in capital, $0.001 par value: 20,000 shares authorized; 5,107 and 5,389 shares issued and outstanding at July 26, 2014 and July 27, 2013, respectively Retained earnings..... Accumulated other comprehensive income Total Cisco shareholders' equity Noncontrolling interests Total equity TOTAL LIABILITIES AND EQUITY See Notes to Consolidated Financial Statements. July 26, 2014 July 27, 2013 6,726 45,348 5,157 1,591 4,153 2,808 1,331 67,114 3,252 3,918 24,239 3,280 3,331 $105,134 508 1,032 159 3,181 9,478 5,451 19,809 20,401 1,851 4,664 1,748 48,473 41,884 14,093 677 56,654 7 $ 7,925 42,685 5,470 1,476 4,037 2,616 1,312 65,521 3,322 3,911 21,919 3,403 3,115 $101,191 $3,283 1,029 192 3,182 9,262 5,048 21,996 12,928 1,748 4,161 1,230 42,063 - 42,297 16,215 608 59,120 8 56,661 59,128 $105,134 $101,191 CISCO SYSTEMS, INC. Consolidated Statements of Operations (in millions, except per-share amounts) Years Ended REVENUE: Product Service Total revenue COST OF SALES: Product Service Total cost of sales GROSS MARGIN OPERATING EXPENSES: Research and development. Sales and marketing General and administrative. Amortization of purchased intangible assets Restructuring and other charges Total operating expenses OPERATING INCOME Interest income Interest expense Other income (loss), net Interest and other income (loss), net INCOME BEFORE PROVISION FOR INCOME TAXES Provision for income taxes NET INCOME Net income per share: Basic... Diluted Shares used in per-share calculation: Basic. Diluted Cash dividends declared per common share July 26, 2014 July 27, 2013 July 28, 2012 $36,172 10,970 47,142 15,641 3,732 19,373 27,769 6,294 9,503 1,934 275 418 18,424 9,345 691 (564) 243 370 9,715 1,862 $ 7,853 $ 1.50 $1.49 5,234 5,281 $ 0.72 $38,029 10,578 48,607 15,541 3,626 19,167 29,440 5,942 9,538 2,264 395 105 18,244 11,196 654 (583) (40) 31 11,227 1,244 $ 9,983 $ 1.87 $ 1.86 5,329 5,380 $ 0.62 $36,326 9,735 46,061 14,505 3,347 17,852 28,209 5,488 9,647 2,322 383 304 18,144 10,065 650 (596) 40 94 10,159 2,118. $ 8,041 $ 1.50 $ 1.49 5,370 5,404 $ 0.28 CISCO SYSTEMS, INC. Consolidated Statements of Cash Flows (in millions) Years Ended Cash flows from operating activities: Net income Adjustments to reconcile net income to net cash provided by operating activities: Depreciation, amortization, and other Share-based compensation expense Provision for receivables Deferred income taxes Excess tax benefits from share-based compensation (Gains) losses on investments and other, net Change in operating assets and liabilities, net of effects of acquisitions and divestitures: Accounts receivable Inventories Financing related Other assets Accounts payable Income taxes, net Accrued compensation Deferred revenue Other liabilities Net cash provided by operating activities. Cash flows from investing activities: Purchases of investments Proceeds from sales of investments Proceeds from maturities of investments Acquisition of businesses, net of cash and cash equivalents acquired Purchases of investments in privately held companies Return of investments in privately held companies Acquisition of property and equipment Proceeds from sales of property and equipment Other.... Net cash used in investing activities Cash flows from financing activities: Issuances of common stock Repurchases of common stock-repurchase program Shares repurchased for tax withholdings on vesting of restricted stock units Short-term borrowings, original maturities less than 90 days, net Issuances of debt.. Repayments of debt Excess tax benefits from share-based compensation Dividends paid Other Net cash used in financing activities Net (decrease) increase in cash and cash equivalents. Cash and cash equivalents, beginning of fiscal year Cash and cash equivalents, end of fiscal year. Supplemental cash flow information: Cash paid for interest Cash paid for income taxes, net July 26, 2014 July 27, 2013 July 28, 2012 $ 7,853 2,432 1,348 79 (678) (118) (299) 340 (109) (119) 33 (23) 191 (42) 659 785 12,332 (1,275) 232 24 (6,643) $ 9,983 2,451 1,120 44 (37) (92) (91) 1,907 (9,413) (430) (2) (1,001) 218 (723) (27) 164 (36,317) (36,608) 18,193 14,799 15,660 17,909 (2,989) (6,766) (384) (225) 213 209 (239) 134 598 392 12,894 (1,160) 141 (67) (11,768) 3,338 (2,773) (330) (20) 24 8,001 (3,276) 118 (3,758) (35) (6,888) (3,000) (1,874) (1,199) 7,925 9,799 $ 6,726 $ 7,925 (16) 92 (3,310) (5) $ 682 $ 682 $ 2,349 $ 1,519 $8,041 2,208 1,401 50 (314) (60) 363 272 (287) (846) (674) (7) 418 (101) 727 300 11,491 (41,782) 27,337 12,103 (375) (380) 242 (1,126) 50 116 (3,815) 1,372 (4,560) (200) (557) 60 (1,501) (153) (5,539) 2,137 7,662 $ 9,799 681 $ 2,014 CISCO SYSTEMS, INC. Consolidated Statements of Equity (in millions, except per-share amounts) BALANCE AT JULY 30, 2011 Net income Other comprehensive income (loss) Issuance of common stock. Repurchase of common stock Shares repurchased for tax withholdings on vesting of restricted stock units Cash dividends declared ($0.28 per common share) Tax effects from employee stock incentive plans Share-based compensation expense Others... BALANCE AT JULY 28, 2012 Net income Other comprehensive income (loss) Issuance of common stock. Repurchase of common stock Shares repurchased for tax withholdings on vesting of restricted stock units Cash dividends declared ($0.62 per common share) Tax effects from employee stock incentive plans Share-based compensation expense.. Others. BALANCE AT JULY 27, 2013 Net income Other comprehensive income (loss) Issuance of common stock Repurchase of common stock Shares repurchased for tax withholdings on vesting of restricted stock units Cash dividends declared ($0.72 per common share) Tax effects from employee stock incentive plans Share-based compensation expense Others... BALANCE AT JULY 26, 2014 Common Stock Accumulated Other Shares of Common and Total Cisco Additional Retained Comprehensive Shareholders' Non-controlling Total Stock Paid-In Capital Earnings Income Equity Interests Equity 5,435 $38,648 $1,294 $ 33 (18) 137 (262) (12) 5,298 235 (128) (16) 5,389 156 (420) (18) 5,107 1,372 (1,890) (200) (66) 1,401 6 $39,271 3,338 (961) (330) (204) 1,120 63 $42,297 1,907 (3,322) (430) 35 1,348 49 $41,884 $ 7,284 8,041 (2,470) (1,501) $11,354 9,983 (1,812) (3,310) (6,217) (3,758) (633) $16,215 $ 608 7,853 $14,093 $ 661 (53) 69 $ 677 $47,226 8,041 (633) 1,372 (4,360) (200) (1,501) (66) 1,401 6 $51,286 9,983 (53) 3,338 (2,773) (330) (3,310) (204) 1,120 63 $59,120 7,853 69 1,907 (9,539) (430) (3,758) 35 1,348 49 $56,654 $ 15 (7) $8 (1) $7 $47,259 8,041 (651) 1,372 (4,360) (200) (1,501) (66) 1,401 6 $51,301 9,983 (60) 3,338 (2,773) (330) (3,310) (204) 1,120 63 $59,128 7,853 68 1,907 (9,539) (430) (3,758) 35 1,348 49 $56,661 6. Balance Sheet Details The following tables provide details of selected balance sheet items (in millions): Property and equipment, net: Land, buildings, and building and leasehold improvements Computer equipment and related software Production, engineering, and other equipment Operating lease assets Furniture and fixtures Less accumulated depreciation and amortization Total.. Deferred revenue: Service Product: Unrecognized revenue on product shipments and other deferred revenue Cash receipts related to unrecognized revenue from two-tier distributors Total product deferred revenue Total Reported as: Current Noncurrent Total July 26, 2014 July 27, 2013 $ 4,468 1,425 5,756 362 509 12,520 (9,268) 3,252 $ 9,640 3,924 578 4,502 $14,142 $ 4,426 1,416 5,721 326 497 12,386 (9,064) $ 3,322 $ 9,403 3,340 680 4,020 $13,423 $ 9,478 4,664 $ 9,262 4,161 $14,142 $13,423 Year ended July 28, 2012: Balance at beginning of fiscal year Provisions (write-offs).. SCHEDULE II VALUATION AND QUALIFYING ACCOUNTS (in millions) Foreign exchange and other Balance at end of fiscal year Year ended July 27, 2013: Balance at beginning of fiscal year Provisions (write-offs).. Foreign exchange and other Balance at end of fiscal year Year ended July 26, 2014: Balance at beginning of fiscal year Provisions... (write-offs) Balance at end of fiscal year Allowances For Financing Accounts Related Receivable $367 31 (3) (15) $380 $380 11 (46) (1) $344 $344 14 (9) $349 Foreign exchange and other includes the impact of foreign exchange and certain immaterial reclassifications. $204 19 (16) $207 $207 33 (12) $228 $228 65 (28) $265
Expert Answer:
Answer rating: 100% (QA)
a As per the extract from Note 13 to the Consolidated Financial Statements During fiscal 2014 Cisco ... View the full answer

Related Book For 

Financial Accounting
ISBN: 978-1259103285
5th Canadian edition
Authors: Robert Libby, Patricia Libby, Daniel Short, George Kanaan, M
Posted Date:
Students also viewed these accounting questions
-
The following is a portion of the Statement of Shareholders? Equity from Cisco Systems? July 29, 2017 annual report. Required: 1. How does Cisco account for its share buybacks? Treasury stock or...
-
Managing Scope Changes Case Study Scope changes on a project can occur regardless of how well the project is planned or executed. Scope changes can be the result of something that was omitted during...
-
The Crazy Eddie fraud may appear smaller and gentler than the massive billion-dollar frauds exposed in recent times, such as Bernie Madoffs Ponzi scheme, frauds in the subprime mortgage market, the...
-
The following are selected 2023 transactions of Ayayai Corporation. Sept. 1 Oct. 1 1 Purchased inventory from Indigo Ltd. on account for $47,200. Ayayai uses a periodic inventory system. Issued a...
-
Explain relationships between TSCA and FIFRA.
-
The parasailing system shown uses a winch to pull the rider in towards the boat, which is travelling with a constant velocity. During the interval when ( is between 20 and 40, (where t = 0 at ( = 20)...
-
Forms are provided in the Working Papers. Work this problem independently. 1. Create a schedule that shows the payment of an annuity over a five-year period. The initial investment is 25,000.00, the...
-
U.S. Multinational Corporations subsidiary in Bangkok has on its books fixed assets valued at 7,500,000 baht. One-third of the assets were acquired two years ago when the exchange rate was THB40 =...
-
You are evaluating a 4-year project, and its cash flows are ($71,000), $18,000, $22,000, $26,000, $19,000 for years 0 to 4, respectively. What is the project's payback period? Note the number in ()...
-
Cooper River Glass Works (CRGW) produces four different models of desk lamps as shown in Figure. The operations manager knows that total monthly demand exceeds the capacity available for production....
-
Stock A has a beta of 1.28 and an expected risk premium of 11.54 percent. Stock B has a beta of 1.5 and an expected risk premium of 12 percent. If the risk-free rate is 4.3 percent, what is the stock...
-
A mass of 5 kg hangs from a spring and makes damped oscillations. If the time of 50 complete oscillations is found to be 20 s, and the ratio of the first downward displacement to the sixth is found...
-
Problem 3. Consider the series on R given by n=1 1+xn Show that this series converges pointwise on (-1, 1) and uniformly on any compact subset of (-1, 1).
-
Carol Kaye asked her cousin Chris Stort to work with her at her business, Beautiful Collections, in the State of Louisiana. At the time Stort was involved in every aspect of the business -...
-
If f(x) = 2x-4 what is its inverse function, f (x)?
-
As Amazon's sales and corresponding shipping volume increase, there is increased pressure on logistics. If there is no proportional increase in staffing and machinery nor an exogenous advance in...
-
A1, A2, A3, and A4 deal with all the 9. Suppose that four attorneys criminal cases in a district court. The following table gives the percentages of the cases that each of these attorneys handles,...
-
Walker, Inc., is an all-equity firm. The cost of the company's equity is currently 11.4 percent and the risk-free.rate is 3.3 percent. The company is currently considering a project that will cost...
-
On March 1, 2014, HiTech Industries purchased 10,000 common shares of Integrated Services Company for $ 20 per share. The following information applies to Integrateds price per share: Date Price 31/...
-
Refer to the financial statements of Canadian Tire Corporation in Appendix A of this book. Required: 1. Does Canadian Tire report income taxes payable as a separate account on its statement of...
-
The comparative statements of earnings of Martin Corporation for fiscal years 2014 and 2015 showed the following summarized pretax data: The expenses in 2014 included an amount of $ 4,000 that was...
-
Which activity is part of the sales order entry process? a. setting customer credit limits b. preparing a bill of lading c. checking customer credit d. approving sales returns
-
For good internal control, who should approve credit memos? a. credit manager c. billing manager b. sales manager d. controller
-
Which document often accompanies merchandise shipped to a customer? a. picking ticket b. packing slip c. credit memo d. sales order

Study smarter with the SolutionInn App