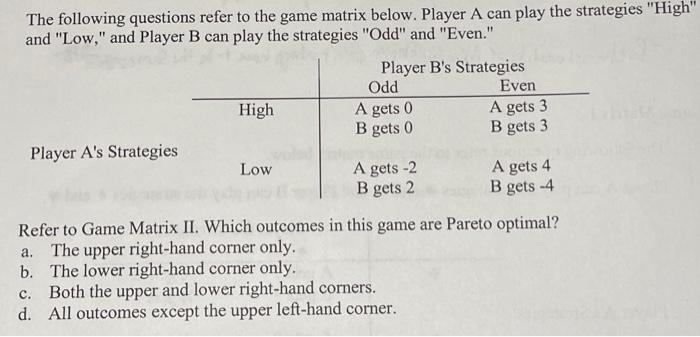
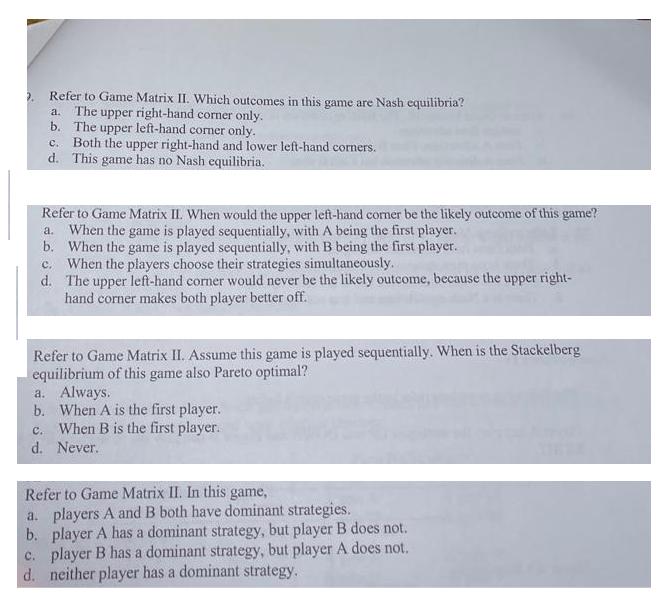
The following questions refer to the game matrix below. Player A can play the strategies High...
Fantastic news! We've Found the answer you've been seeking!
Question:
Transcribed Image Text:
The following questions refer to the game matrix below. Player A can play the strategies "High" and "Low," and Player B can play the strategies "Odd" and "Even." Player A's Strategies High Low Player B's Strategies Odd A gets 0 B gets 0 A gets -2 B gets 2 Even A gets 3 B gets 3 c. Both the upper and lower right-hand corners. d. All outcomes except the upper left-hand corner. A gets 4 B gets -4 Refer to Game Matrix II. Which outcomes in this game are Pareto optimal? a. The upper right-hand corner only. b. The lower right-hand corner only. 9. Refer to Game Matrix II. Which outcomes in this game are Nash equilibria? a. The upper right-hand corner only. b. The upper left-hand corner only. c. Both the upper right-hand and lower left-hand corners. d. This game has no Nash equilibria. Refer to Game Matrix II. When would the upper left-hand corner be the likely outcome of this game? a. When the game is played sequentially, with A being the first player. b. When the game is played sequentially, with B being the first player. When the players choose their strategies simultaneously. c. d. The upper left-hand corner would never be the likely outcome, because the upper right- hand corner makes both player better off. Refer to Game Matrix II. Assume this game is played sequentially. When is the Stackelberg equilibrium of this game also Pareto optimal? a. Always. b. When A is the first player. c. When B is the first player. d. Never. Refer to Game Matrix II. In this game, a. players A and B both have dominant strategies. b. player A has a dominant strategy, but player B does not. c. player B has a dominant strategy, but player A does not. d. neither player has a dominant strategy. The following questions refer to the game matrix below. Player A can play the strategies "High" and "Low," and Player B can play the strategies "Odd" and "Even." Player A's Strategies High Low Player B's Strategies Odd A gets 0 B gets 0 A gets -2 B gets 2 Even A gets 3 B gets 3 c. Both the upper and lower right-hand corners. d. All outcomes except the upper left-hand corner. A gets 4 B gets -4 Refer to Game Matrix II. Which outcomes in this game are Pareto optimal? a. The upper right-hand corner only. b. The lower right-hand corner only. 9. Refer to Game Matrix II. Which outcomes in this game are Nash equilibria? a. The upper right-hand corner only. b. The upper left-hand corner only. c. Both the upper right-hand and lower left-hand corners. d. This game has no Nash equilibria. Refer to Game Matrix II. When would the upper left-hand corner be the likely outcome of this game? a. When the game is played sequentially, with A being the first player. b. When the game is played sequentially, with B being the first player. When the players choose their strategies simultaneously. c. d. The upper left-hand corner would never be the likely outcome, because the upper right- hand corner makes both player better off. Refer to Game Matrix II. Assume this game is played sequentially. When is the Stackelberg equilibrium of this game also Pareto optimal? a. Always. b. When A is the first player. c. When B is the first player. d. Never. Refer to Game Matrix II. In this game, a. players A and B both have dominant strategies. b. player A has a dominant strategy, but player B does not. c. player B has a dominant strategy, but player A does not. d. neither player has a dominant strategy.
Expert Answer:
Answer rating: 100% (QA)
The detailed answer for the above question is provided below t payer 1 Benefit player 2 Benifit comm... View the full answer
Related Book For
Managerial Economics A Problem Solving Approach
ISBN: 978-1133951483
3rd edition
Authors: Luke M. Froeb, Brian T. McCann, Mikhael Shor, Michael R. War
Posted Date:
Students also viewed these accounting questions
-
The following questions refer to Side Bar: Key Provisions of the GATT. a. If the United States applies a tariff to a particular product (e.g., steel) imported from one country, what is the...
-
The following questions refer to Fig. the IDF curve for Houston, Texas. (a) What is the return period of a storm that recorded 3.1 in./hr for 2 hr in Houston? (b) What amount of rain (in.) would have...
-
The following questions refer to the production of monoclonal antibodies. (a) Why are myeloma cells used? (b) Do all cells growing in the selective medium produce antibodies to antigen X? (c) Why do...
-
Horizon BP in Antelope Park, Alaska, has noticed that utility bills are substantially higher when the average monthly temperature is colder. The only thing in the shop that uses natural gas is the...
-
For the year ended December 31, 20X2, a company had cash collections from customers of $50,000, cash paid to employees of $8,000, cash used to retire long term bonds of $7,000 and cash payments for...
-
The 129 Xe- and 19 F-NMR spectra of [XeF 3 ] + are shown in Fig. 8.56. Interpret these spectra in light of the shape of [XeF 3 ] + predicted from VSEPR theory. Figure 8.56. 620 129Xe | 40 600 - 6...
-
In Example 6.3, what is the change in the cart's kinetic energy due to the shove (a) in the Earth reference frame, (b) in a reference frame moving in the same direction as the cart at \(0.60...
-
Condensed balance sheet and income statement data for Sadecki Corporation are presented here and on the next page Instructions Compute the following values and ratios for 2013 and 2014. (a) Earnings...
-
Question 2) Suppose there were an alternative replacement machine that could do the same job as the new stamping machine under your consideration in Question 1. The alternate choice offers the...
-
Design a jib crane as shown in Figure P5-60 that will support a downward load of 6000 lb. Choose a common structural steel shape for all members. Use allowable stresses of 0.66Sy (Sy is the yield...
-
Describe two methods to generate random values from an exponential distributional distribution (f(x) = hexp(-Ax), x> 0). What is an advantage and disadvantage of each method?
-
What is EOQ (economic order quantity)?
-
Why is the perfectly competitive mode a model of efficiency? How have the courts dealt with market inefficiencies or failures and price regulation?
-
A JIT system will usually result in a. a low annual holding cost. b. very few orders per year. c. frequent shutdowns in an assembly line. d. high levels of safety stock.
-
The probability of an event occurring given that another event has taken place is a. priory probability. b. empirical probability. c. conditional probability. d. subjective probability. e. none of...
-
A decision tree is preferable to a decision table when a. a number of sequential decisions are to be made. b. probabilities are available. c. the maximax criterion is used. d. the objective is to...
-
Mr. Samuel Xavier was recently named as the top fund manager who manages an equity portfolio valued at RM8.92 million at Aptitude Mutual Fund Berhad. Despite the world's promising economic condition,...
-
(a) Use integration by parts to show that (b) If f and g are inverse functions and f' is continuous, prove that (c) In the case where f and t are positive functions and b > a > 0, draw a diagram to...
-
When China reformed state-owned enterprises, it tried a new approach to choosing managers: it put managerial jobs up for auction. The bids for the jobs consisted of promises of future profit streams...
-
Moe Green estimates the cost of future projects for a large contracting firm. Mr. Green uses precisely the same techniques to estimate the costs of every potential job, and formulates bids by adding...
-
The smart phone market has been dominated by Apple, but recently the Droid has been able to leverage Google's information services into market gains while Blackberry, known for its secure business...
-
Construct a frequency and relative frequency histogram of the five-year rate of- return data discussed in Example 3. Approach To draw the frequency histogram, use the frequency distribution in Table...
-
Construct a frequency and relative frequency histogram of the five-year rate of- return data discussed in Example 3. Approach We will use StatCrunch to construct the frequency and relative frequency...
-
The data in Table 14 represent the two-year average percentage of persons living in poverty, by state, for the years 20122013. Draw a stem-and-leaf plot of the data. Approach Step 1 Treat the integer...
Study smarter with the SolutionInn App