

Question: The following scatterplot shows the mean annual carbon dioxide (CO2 ) in parts per million (ppm) measured at the top of a a) What is
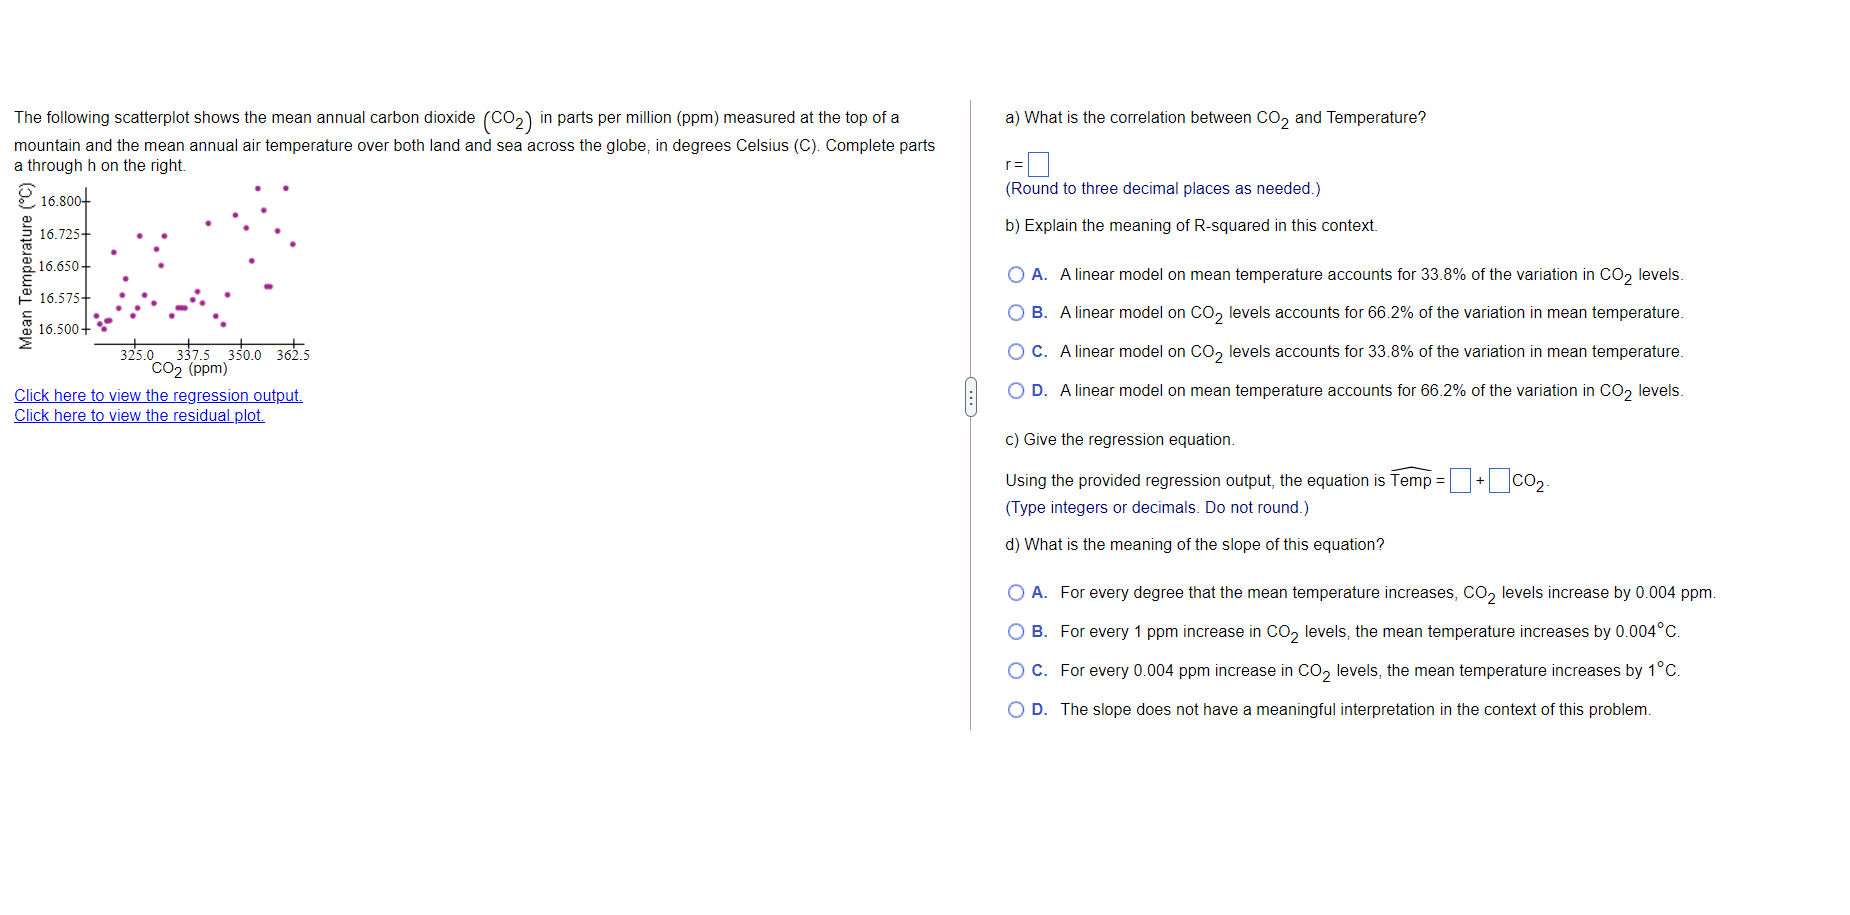
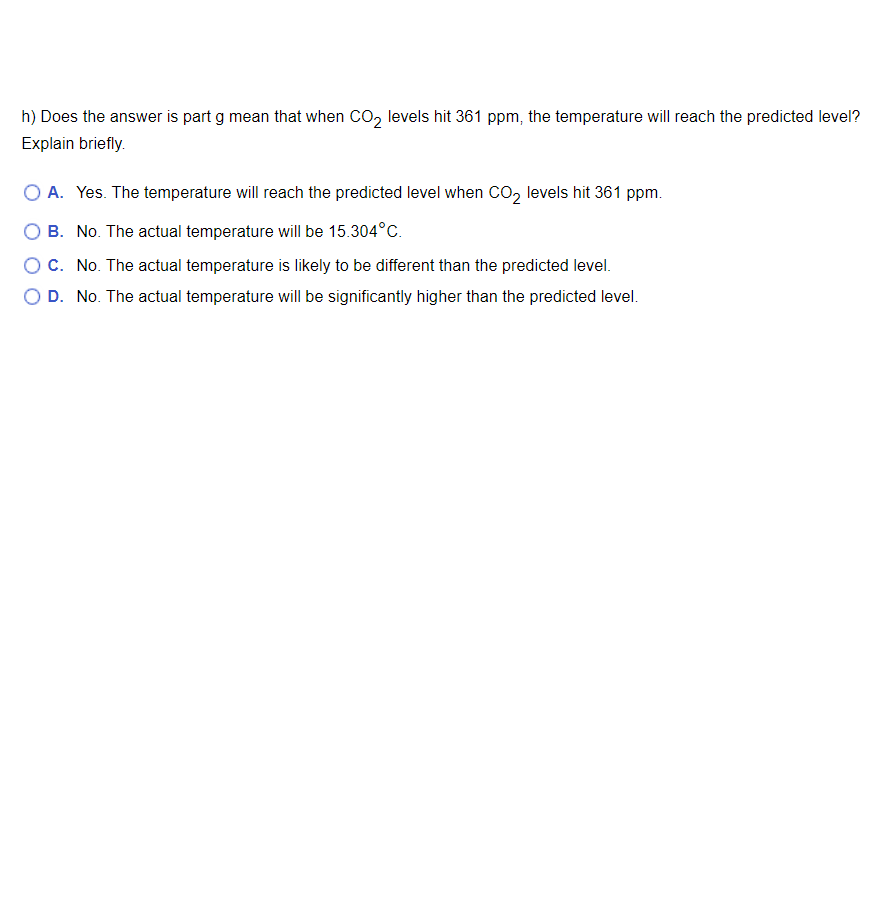
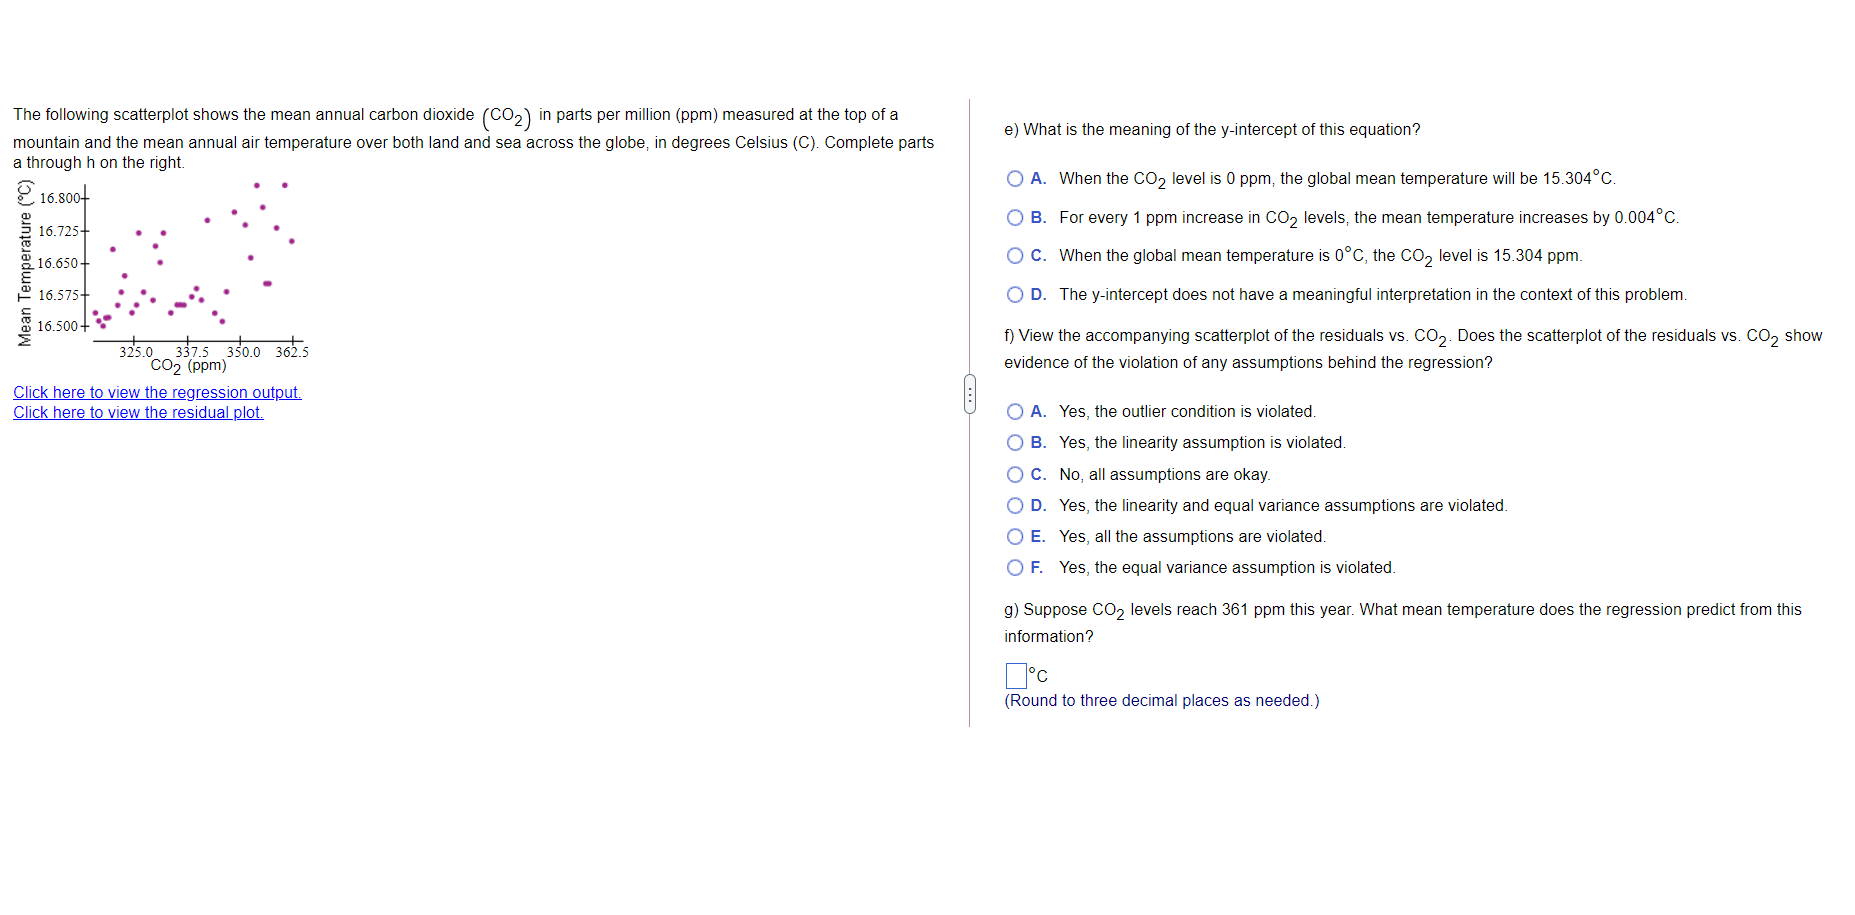
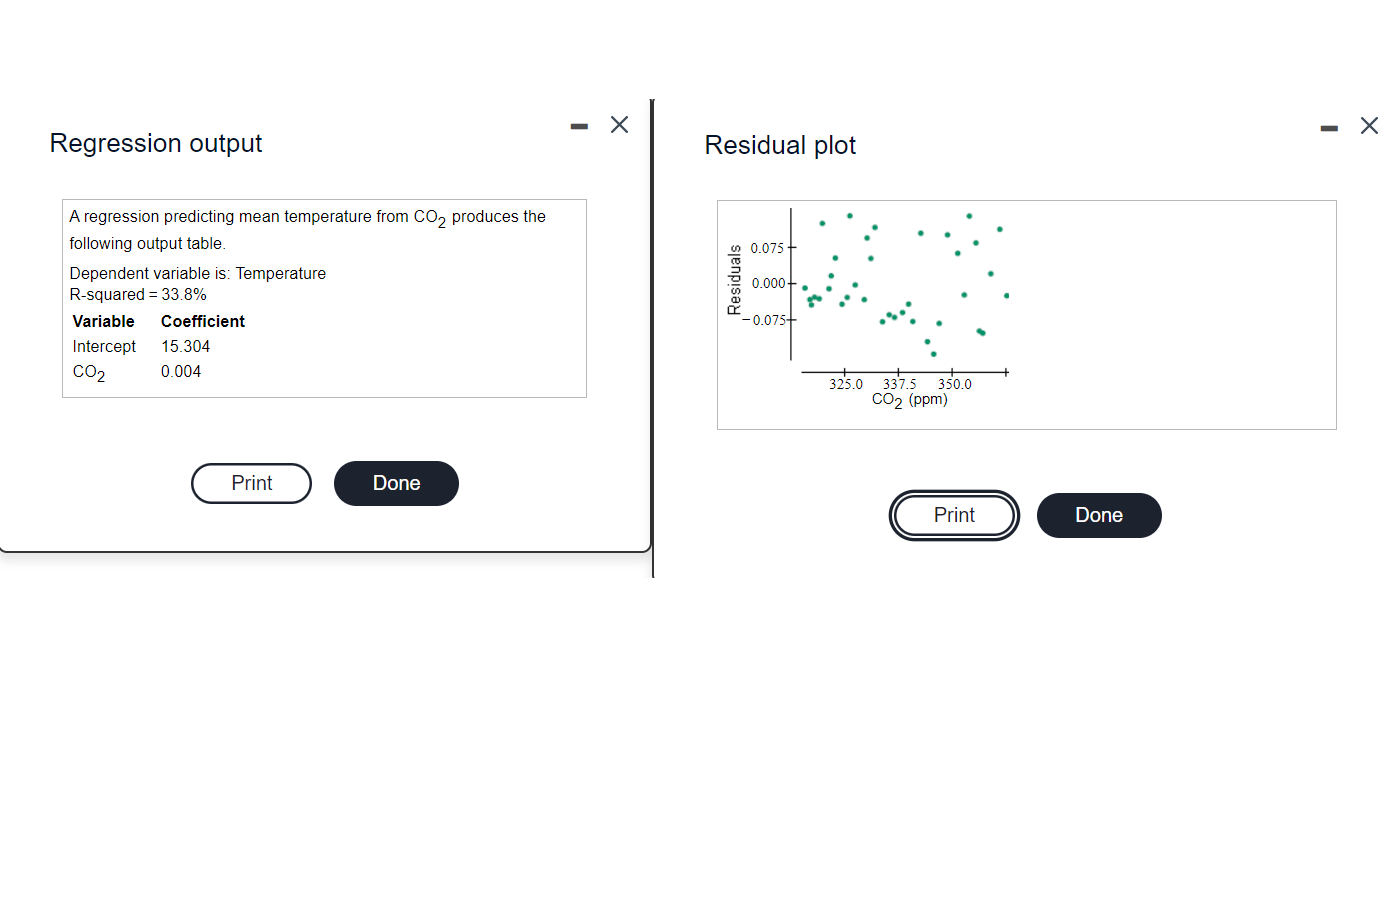
The following scatterplot shows the mean annual carbon dioxide (CO2 ) in parts per million (ppm) measured at the top of a a) What is the correlation between CO2 and Temperature? mountain and the mean annual air temperature over both land and sea across the globe, in degrees Celsius (C). Complete parts a through h on the right. 2 16.800- (Round to three decimal places as needed.) 16.725- b) Explain the meaning of R-squared in this context. 16.650- Mean Temperature ( O A. A linear model on mean temperature accounts for 33.8% of the variation in CO2 levels. 16.575 O B. A linear model on CO2 levels accounts for 66.2% of the variation in mean temperature. 16.500+ 325.0 337.5 350.0 362.5 O C. A linear model on CO2 levels accounts for 33.8% of the variation in mean temperature. CO2 (ppm) Click here to view the regression output. O D. A linear model on mean temperature accounts for 66.2% of the variation in CO2 levels. Click here to view the residual plot. c) Give the regression equation. Using the provided regression output, the equation is Temp =+coz (Type integers or decimals. Do not round.) d) What is the meaning of the slope of this equation? O A. For every degree that the mean temperature increases, CO2 levels increase by 0.004 ppm. O B. For every 1 ppm increase in CO2 levels, the mean temperature increases by 0.004 C. O C. For every 0.004 ppm increase in CO2 levels, the mean temperature increases by 1 C. O D. The slope does not have a meaningful interpretation in the context of this problem.h) Does the answer is part g mean that when CO2 levels hit 361 ppm, the temperature will reach the predicted level? Explain briefly. O A. Yes. The temperature will reach the predicted level when CO2 levels hit 361 ppm. O B. No. The actual temperature will be 15.304"C. O C. No. The actual temperature is likely to be different than the predicted level. O D. No. The actual temperature will be significantly higher than the predicted level.The following scatterplot shows the mean annual carbon dioxide (CO2 ) in parts per million (ppm) measured at the top of a mountain and the mean annual air temperature over both land and sea across the globe, in degrees Celsius (C). Complete parts e) What is the meaning of the y-intercept of this equation? a through h on the right. O A. When the CO2 level is 0 ppm, the global mean temperature will be 15.304 C. 16.800- O B. For every 1 ppm increase in CO2 levels, the mean temperature increases by 0.004C. 2 16.725- 16.650 O C. When the global mean temperature is 0 C, the CO2 level is 15.304 ppm. Mean Temperature ( 16.575 O D. The y-intercept does not have a meaningful interpretation in the context of this problem. 16.500+ f) View the accompanying scatterplot of the residuals vs. CO2. Does the scatterplot of the residuals vs. CO, show 325.0 337.5 350.0 362.5 CO2 (ppm) evidence of the violation of any assumptions behind the regression? Click here to view the regression output. Click here to view the residual plot. O A. Yes, the outlier condition is violated O B. Yes, the linearity assumption is violated. O C. No, all assumptions are okay. O D. Yes, the linearity and equal variance assumptions are violated. O E. Yes, all the assumptions are violated. O F. Yes, the equal variance assumption is violated. g) Suppose CO2 levels reach 361 ppm this year. What mean temperature does the regression predict from this information? (Round to three decimal places as needed.)- X - X Regression output Residual plot A regression predicting mean temperature from CO2 produces the following output table. 0.075+ Dependent variable is: Temperature Residuals 0.000 R-squared = 33.8% Variable Coefficient - 0.075- Intercept 15.304 CO2 0.004 325.0 337.5 350.0 CO2 (ppm) Print Done Print Done
Step by Step Solution
There are 3 Steps involved in it

Get step-by-step solutions from verified subject matter experts