

Question: The following table shows normal time, normal cost, crash time, and crash cost of a project. Normal Crash Activity ID Maximum Time (day) Cost crash
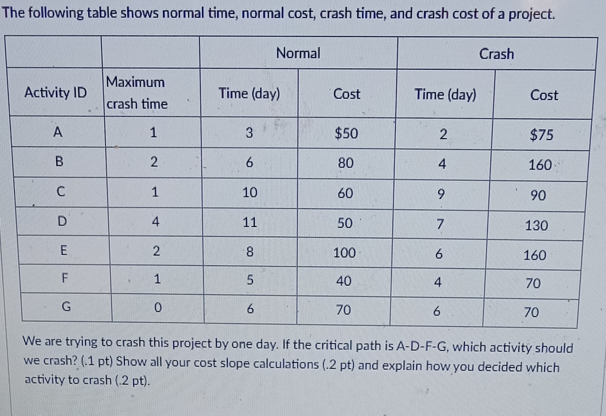
The following table shows normal time, normal cost, crash time, and crash cost of a project. Normal Crash Activity ID Maximum Time (day) Cost crash time Time (day) Cost A 3 $50 2 $75 B 2 6 80 4 160. C 1 10 60 9 90 D 4 11 50 7 130 E 8 100 6 160 1 5 40 4 70 G 0 6 70 6 70 We are trying to crash this project by one day. If the critical path is A-D-F-G, which activity should we crash? (.1 pt) Show all your cost slope calculations (.2 pt) and explain how you decided which activity to crash (.2 pt)
Step by Step Solution
There are 3 Steps involved in it
1 Expert Approved Answer
Step: 1 Unlock

Question Has Been Solved by an Expert!
Get step-by-step solutions from verified subject matter experts
Step: 2 Unlock
Step: 3 Unlock