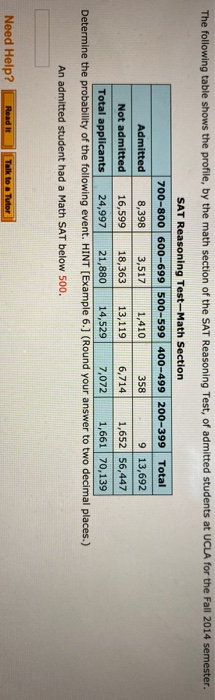
Question: The following table shows the profile, by the math section of the SAT Reasoning Test, of admitted students at UCLA for the Fall 2014 semester.

The following table shows the profile, by the
The following table shows the profile, by the math section of the SAT Reasoning Test, of admitted students at UCLA for the Fall 2014 semester. SAT Reasoning Test-Math Section Admitted 8,398 3,517 1,410 358 913,692 Not admitted 16,599 18,363 13,119 6,714 1,652 56,447 Total applicants 24,997 21,880 14,529 7,072 1,661 70,139 Determine the probability of the following event. HINT (Example 6.) (Round your answer to two decimal places.) An admitted student had a Math SAT below 500. Need Help? Read It Talk to a Tutor

Step by Step Solution

There are 3 Steps involved in it

1 Expert Approved Answer
Step: 1 Unlock blur-text-image
Question Has Been Solved by an Expert!

Get step-by-step solutions from verified subject matter experts

Step: 2 Unlock
Step: 3 Unlock

Students Have Also Explored These Related General Management Questions!