

Question: The frequency distribution below shows the distribution of a sample of 100 new Covid patients at an Urgent Care center by age. Please complete the
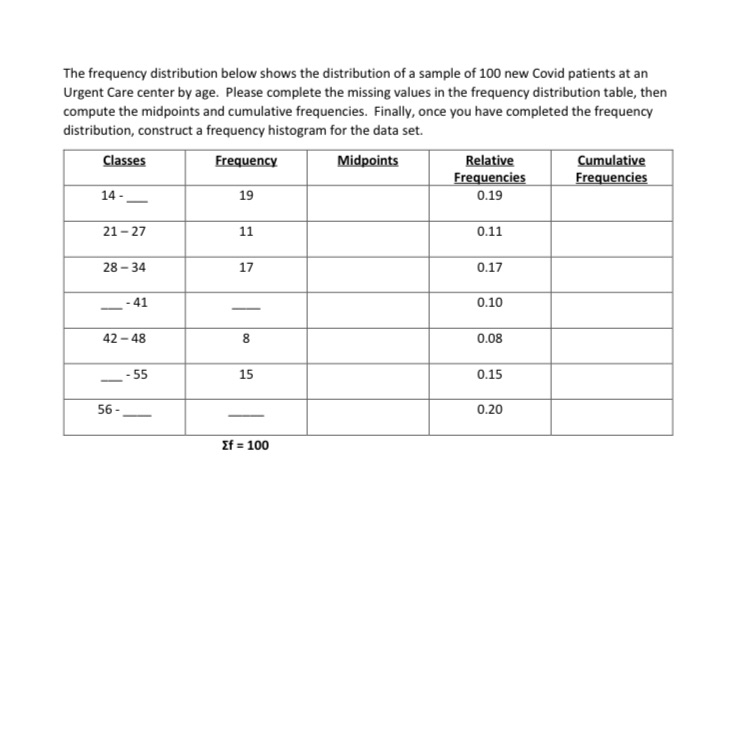
The frequency distribution below shows the distribution of a sample of 100 new Covid patients at an Urgent Care center by age. Please complete the missing values in the frequency distribution table, then compute the midpoints and cumulative frequencies. Finally, once you have completed the frequency distribution, construct a frequency histogram for the data set. Classes Frequency Midpoints Relative Cumulative Frequencies Frequencies 14 19 0.19 21 -27 11 0.11 28 -34 17 0.17 - 41 0.10 42 - 48 8 0.08 -- 55 15 0.15 56 0.20 If = 100
Step by Step Solution
There are 3 Steps involved in it
1 Expert Approved Answer
Step: 1 Unlock

Question Has Been Solved by an Expert!
Get step-by-step solutions from verified subject matter experts
Step: 2 Unlock
Step: 3 Unlock