

Question: The frequency distribution in the table respresents the square footage of a random sample of 525 houses that are owner occupied year round. Approximate the
The frequency distribution in the table respresents the square footage of a random sample of 525 houses that are owner occupied year round. Approximate the mean and standard deviation square footage.
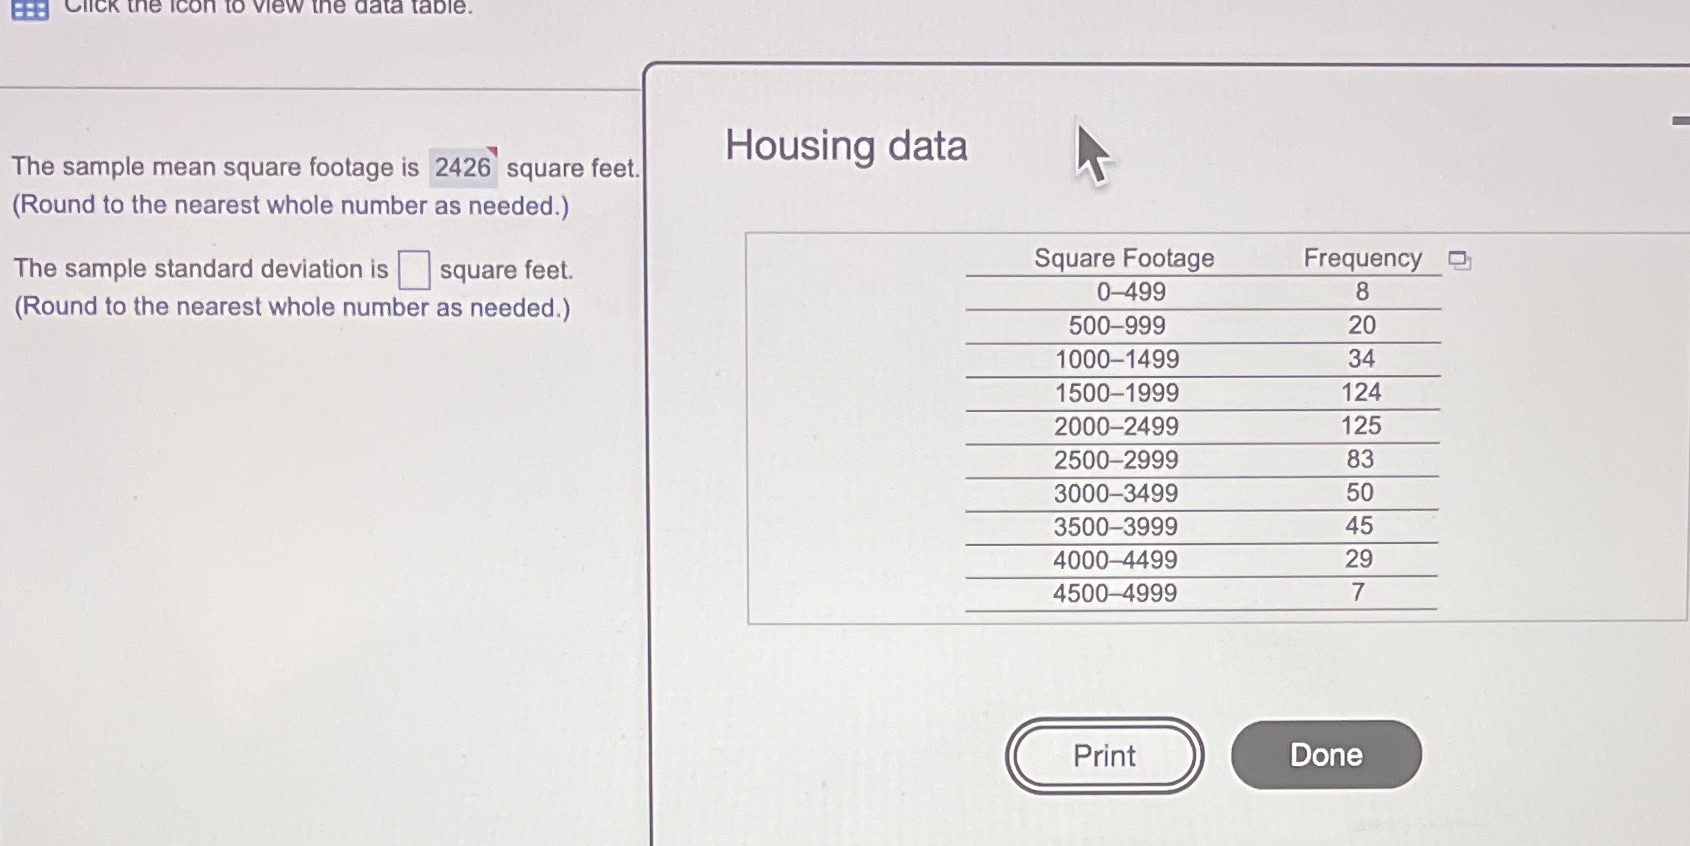
Click the icon to view the data table. The sample mean square footage is 2426 square feet. Housing data (Round to the nearest whole number as needed.) The sample standard deviation is square feet. Square Footage Frequency 8 (Round to the nearest whole number as needed.) 0-499 500-999 20 1000-1499 34 1500-1999 124 2000-2499 125 2500-2999 83 3000-3499 50 3500-3999 45 4000-4499 29 4500-4999 7 Print Done
Step by Step Solution
There are 3 Steps involved in it
1 Expert Approved Answer
Step: 1 Unlock

Question Has Been Solved by an Expert!
Get step-by-step solutions from verified subject matter experts
Step: 2 Unlock
Step: 3 Unlock