

Question: The frequency distribution was obtained using a class width of 0.5 for data on cigarette tax rates. Use the frequency distribution to approximate the population
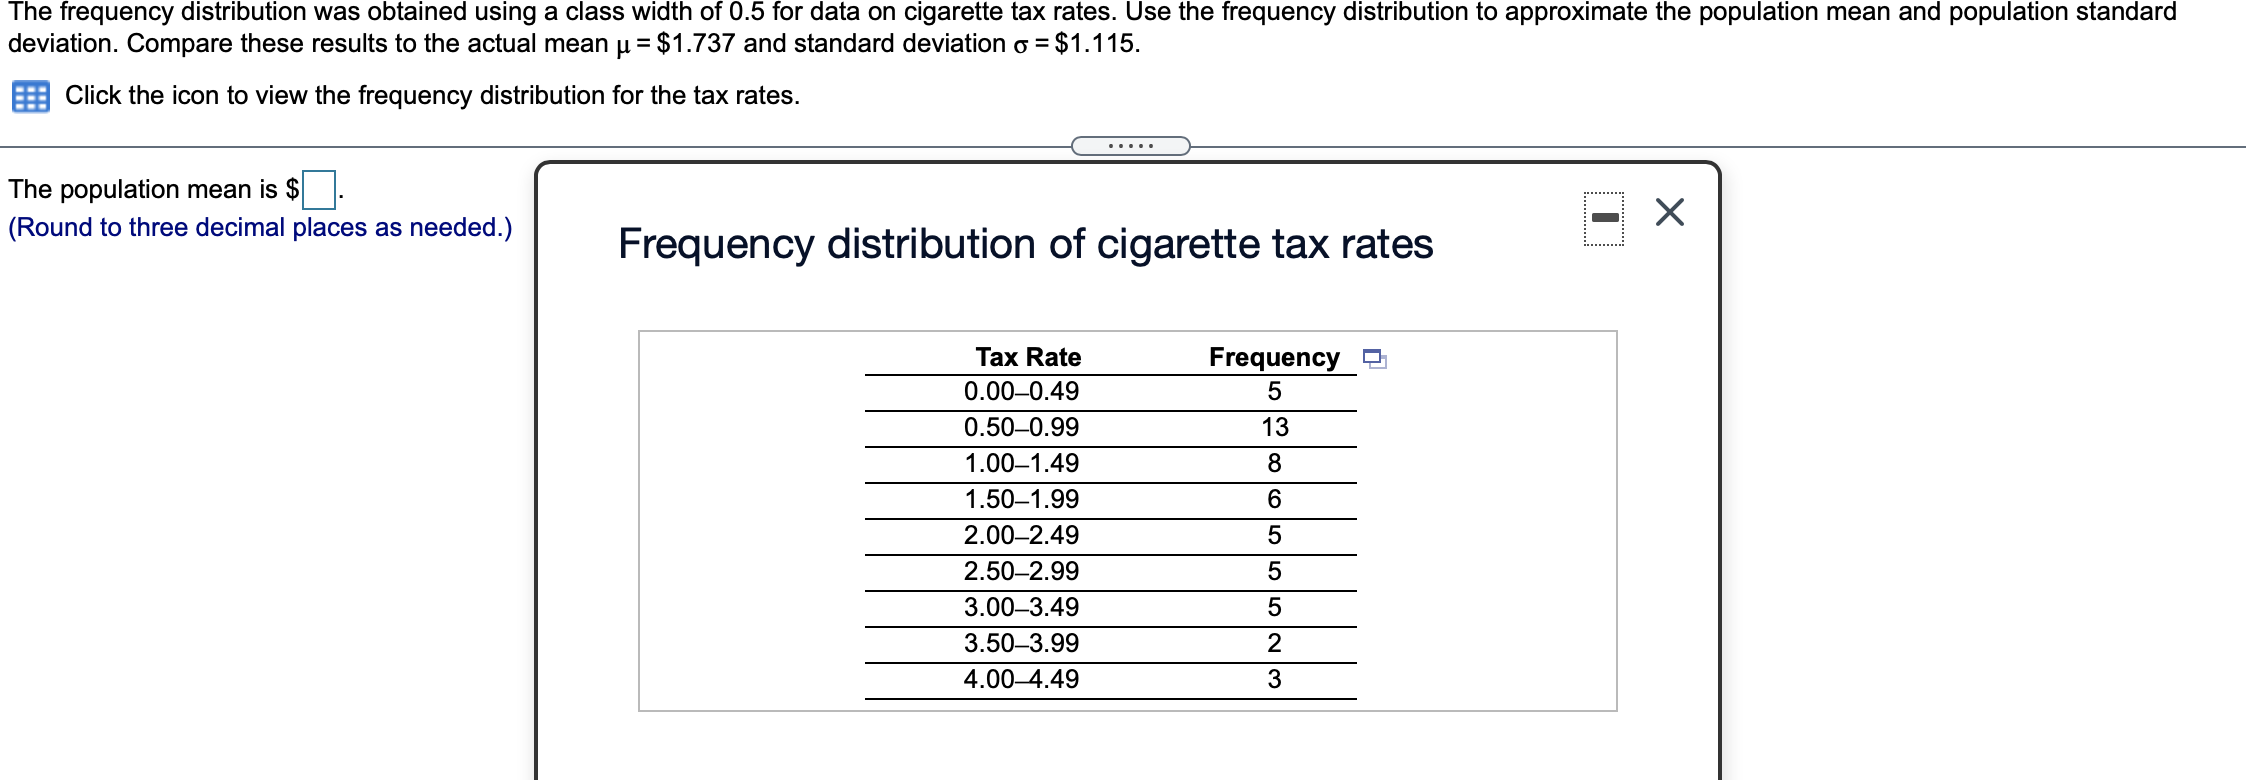
The frequency distribution was obtained using a class width of 0.5 for data on cigarette tax rates. Use the frequency distribution to approximate the population mean and population standard deviation. Compare these results to the actual mean p,= $1.737 and standard deviation 6 =$1.115. a Click the icon to view the frequency distribution for the tax rates. The population mean is $ . (Round to three decimal places as needed.) Frequency distribution of cigarette tax rates Tax Rate Frequency % 0.000.49 5 0.500.99 13 1.001.49 1.501.99 2.002.49 2.502.99 3.003.49 3.503.99 4.004.49
Step by Step Solution
There are 3 Steps involved in it
1 Expert Approved Answer
Step: 1 Unlock

Question Has Been Solved by an Expert!
Get step-by-step solutions from verified subject matter experts
Step: 2 Unlock
Step: 3 Unlock