

Question: The frequency distribution was obtained using a class width of 0.5 for data on cigarette tax rates. Use the frequency distribution to approximate the population
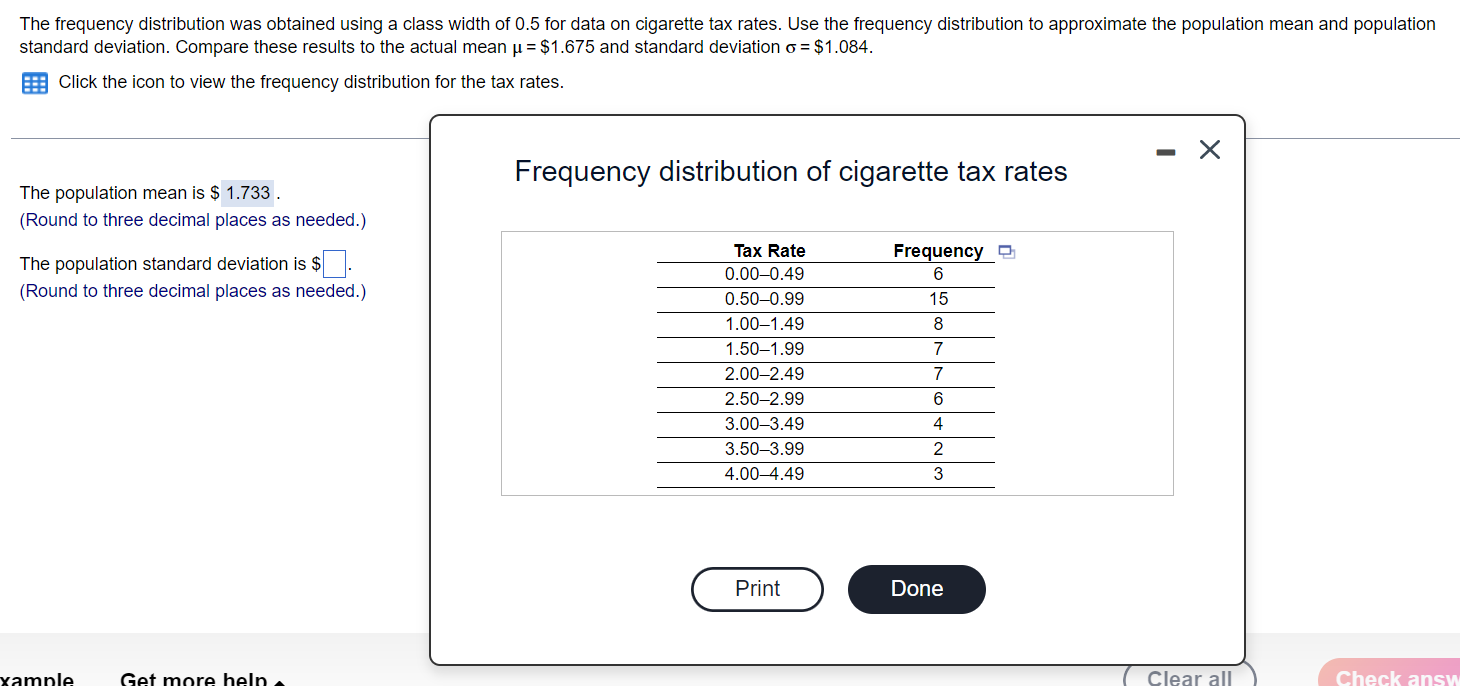
The frequency distribution was obtained using a class width of 0.5 for data on cigarette tax rates. Use the frequency distribution to approximate the population mean and population standard deviation. Compare these results to the actual mean u = $1.675 and standard deviation o = $1.084. Click the icon to view the frequency distribution for the tax rates. - X Frequency distribution of cigarette tax rates The population mean is $ 1.733 (Round to three decimal places as needed.) The population standard deviation is $ Tax Rate Frequency 0.00-0.49 6 (Round to three decimal places as needed.) 0.50-0.99 15 1.00-1.49 8 1.50-1.99 7 2.00-2.49 2.50-2.99 6 3.00-3.49 3.50-3.99 W N A 4.00-4.49 Print Done ple Get more help Clear all Check answ
Step by Step Solution
There are 3 Steps involved in it

Get step-by-step solutions from verified subject matter experts