

Question: The frequency distribution was obtained using a class width of 0.5 for data on cigarette tax rates. Use the frequency distribution to approximate the population
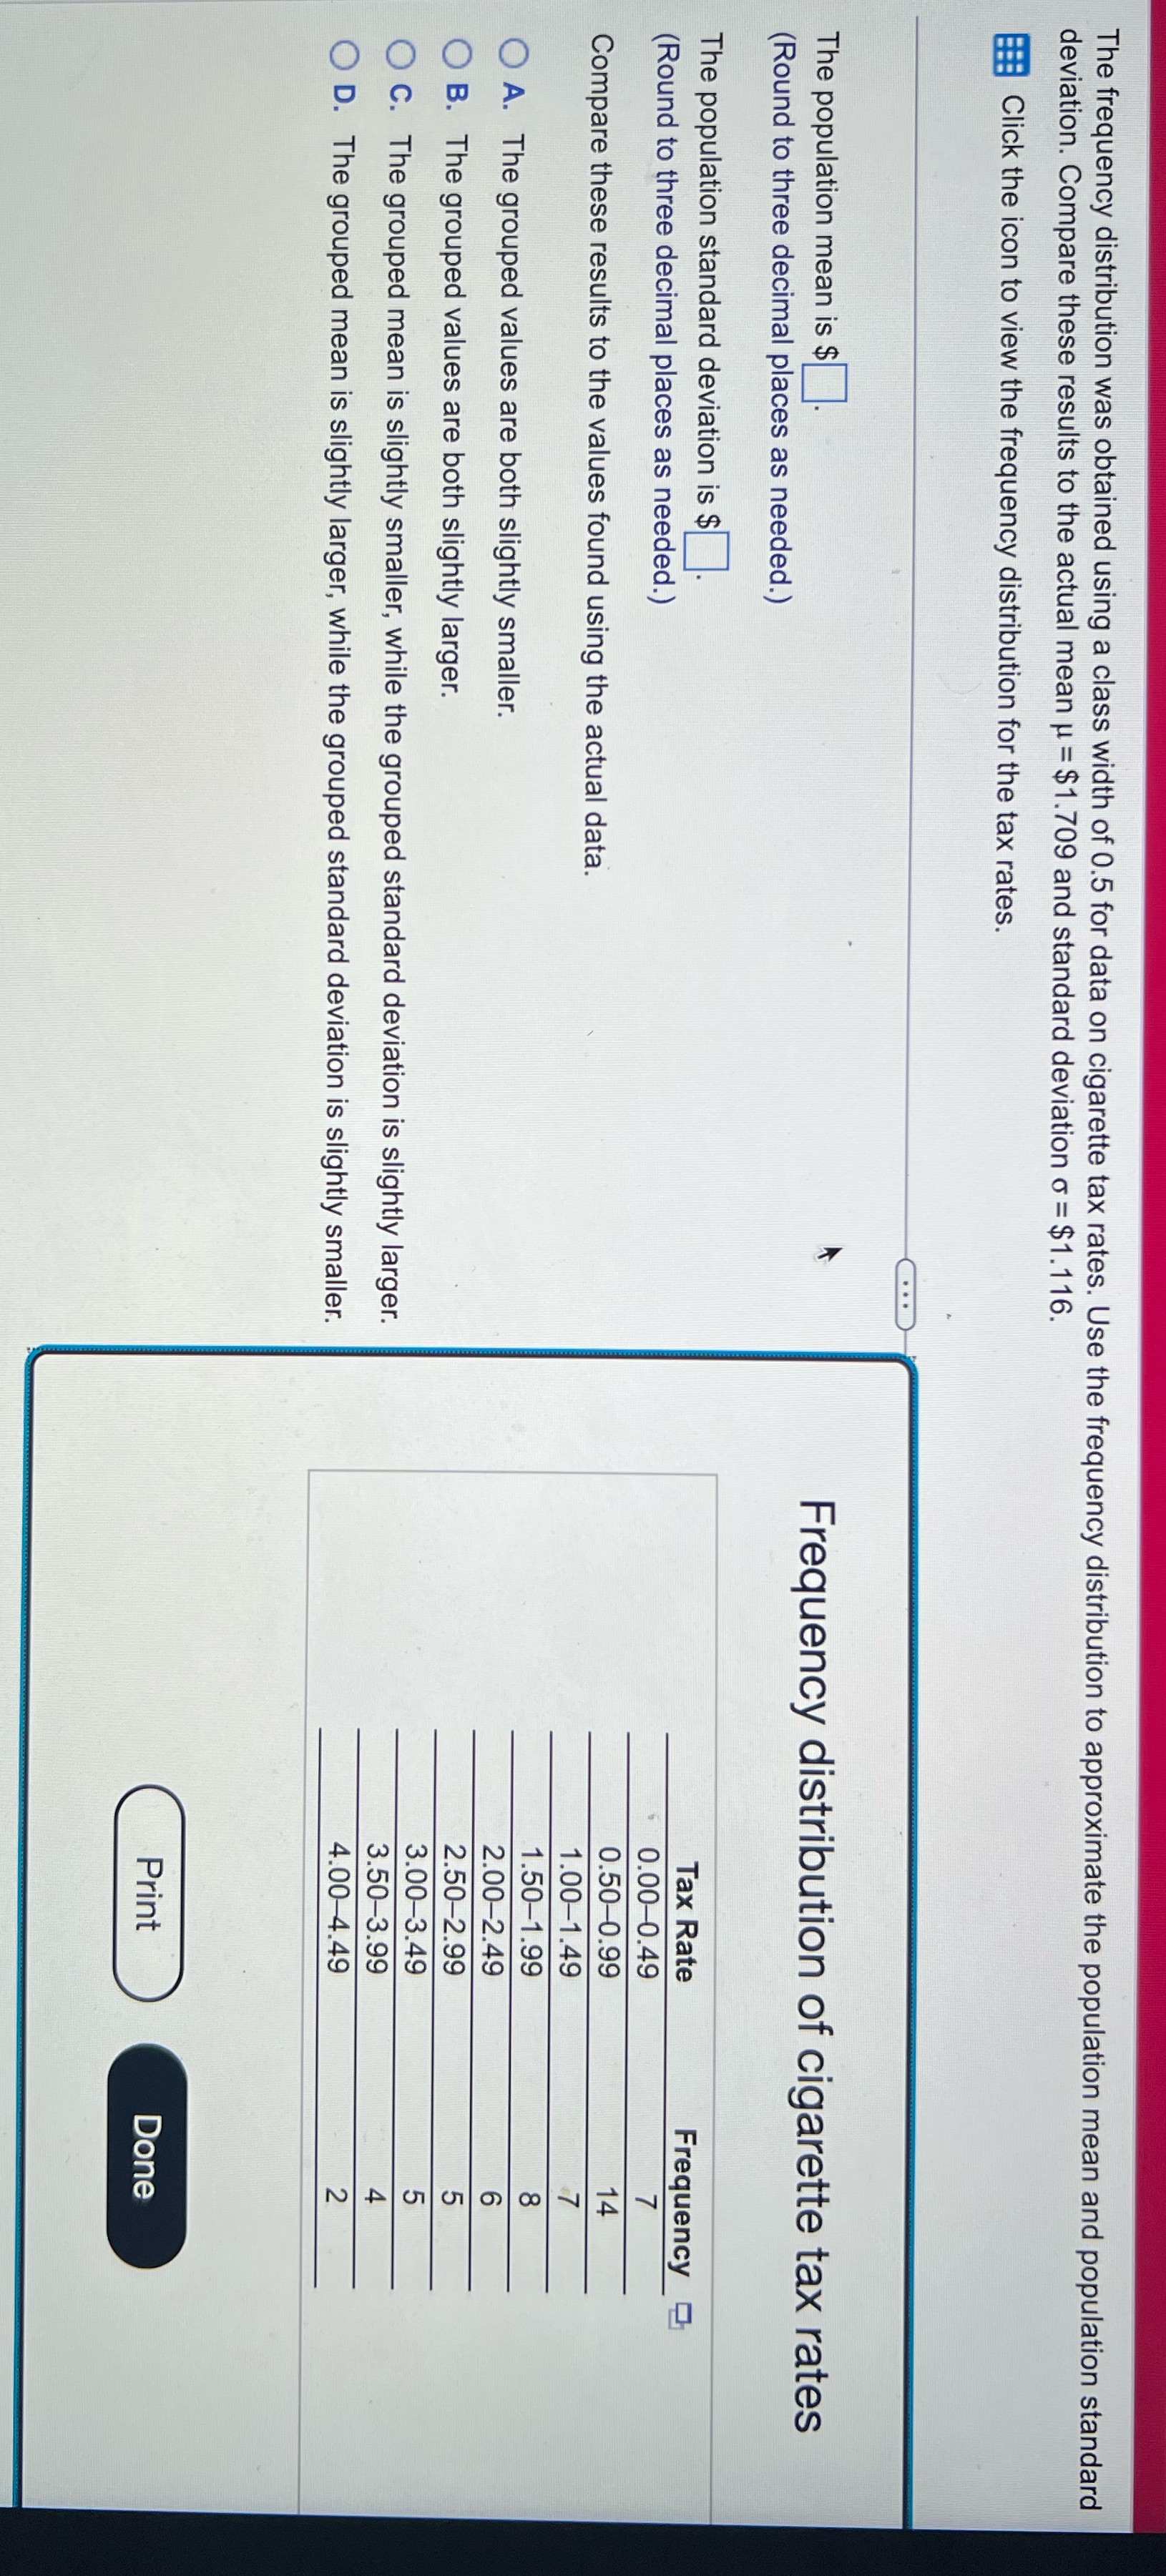
The frequency distribution was obtained using a class width of 0.5 for data on cigarette tax rates. Use the frequency distribution to approximate the population mean and population standard deviation. Compare these results to the actual mean u = $1.709 and standard deviation o = $1. 116. Click the icon to view the frequency distribution for the tax rates. The population mean is $. Frequency distribution of cigarette tax rates (Round to three decimal places as needed.) The population standard deviation is $ ]. Tax Rate Frequency (Round to three decimal places as needed.) 0.00-0.49 0.50-0.99 Compare these results to the values found using the actual data. 1.00-1.49 1.50-1.99 O A. The grouped values are both slightly smaller. 2.00-2.49 J OO CO LO LO + NV O B. The grouped values are both slightly larger. 2.50-2.99 3.00-3.49 O C. The grouped mean is slightly smaller, while the grouped standard deviation is slightly larger. 3.50-3.99 O D. The grouped mean is slightly larger, while the grouped standard deviation is slightly smaller. 4.00-4.49 Print Done
Step by Step Solution
There are 3 Steps involved in it

Get step-by-step solutions from verified subject matter experts