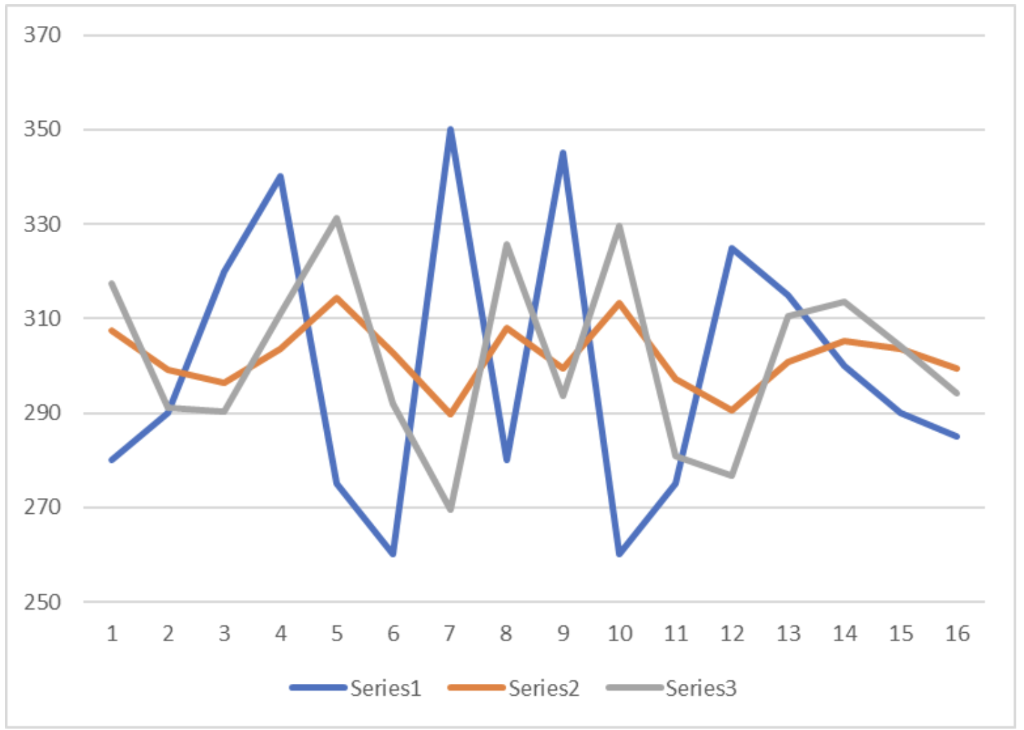
Question: The graph below contains three lines. One line is the actual sales, one line is forecast with exponential smoothing and an alpha value of 0.3

The graph below contains three lines. One line is

The graph below contains three lines. One line is

The graph below contains three lines. One line is

The graph below contains three lines. One line is the actual sales, one line is forecast with exponential smoothing and an alpha value of 0.3 and one line is a forecast with exponential smoothing and an alpha value of 0.7. Which line is which? 370 350 330 310 290 270 250 1 2 3 4 5 6 7 8 9 10 11 12 13 14 15 16 Series1 Series2 Series There is not enough information provided to answer Series 1 is alpha =0.7, series 2 is alpha = 0.3, series 3 is actual. = Series 1 is actual, Series 2 is alpha =0.3, series 3 is alpha =0.7. Series 1 is alpha = 0.3, series 2 is alpha =0.4, series 3 is actual. Series 1 is actual, series 2 is alpha =0.7, series 3 is alpha =0.3

Step by Step Solution

There are 3 Steps involved in it

1 Expert Approved Answer
Step: 1 Unlock blur-text-image
Question Has Been Solved by an Expert!

Get step-by-step solutions from verified subject matter experts

Step: 2 Unlock
Step: 3 Unlock

Students Have Also Explored These Related General Management Questions!