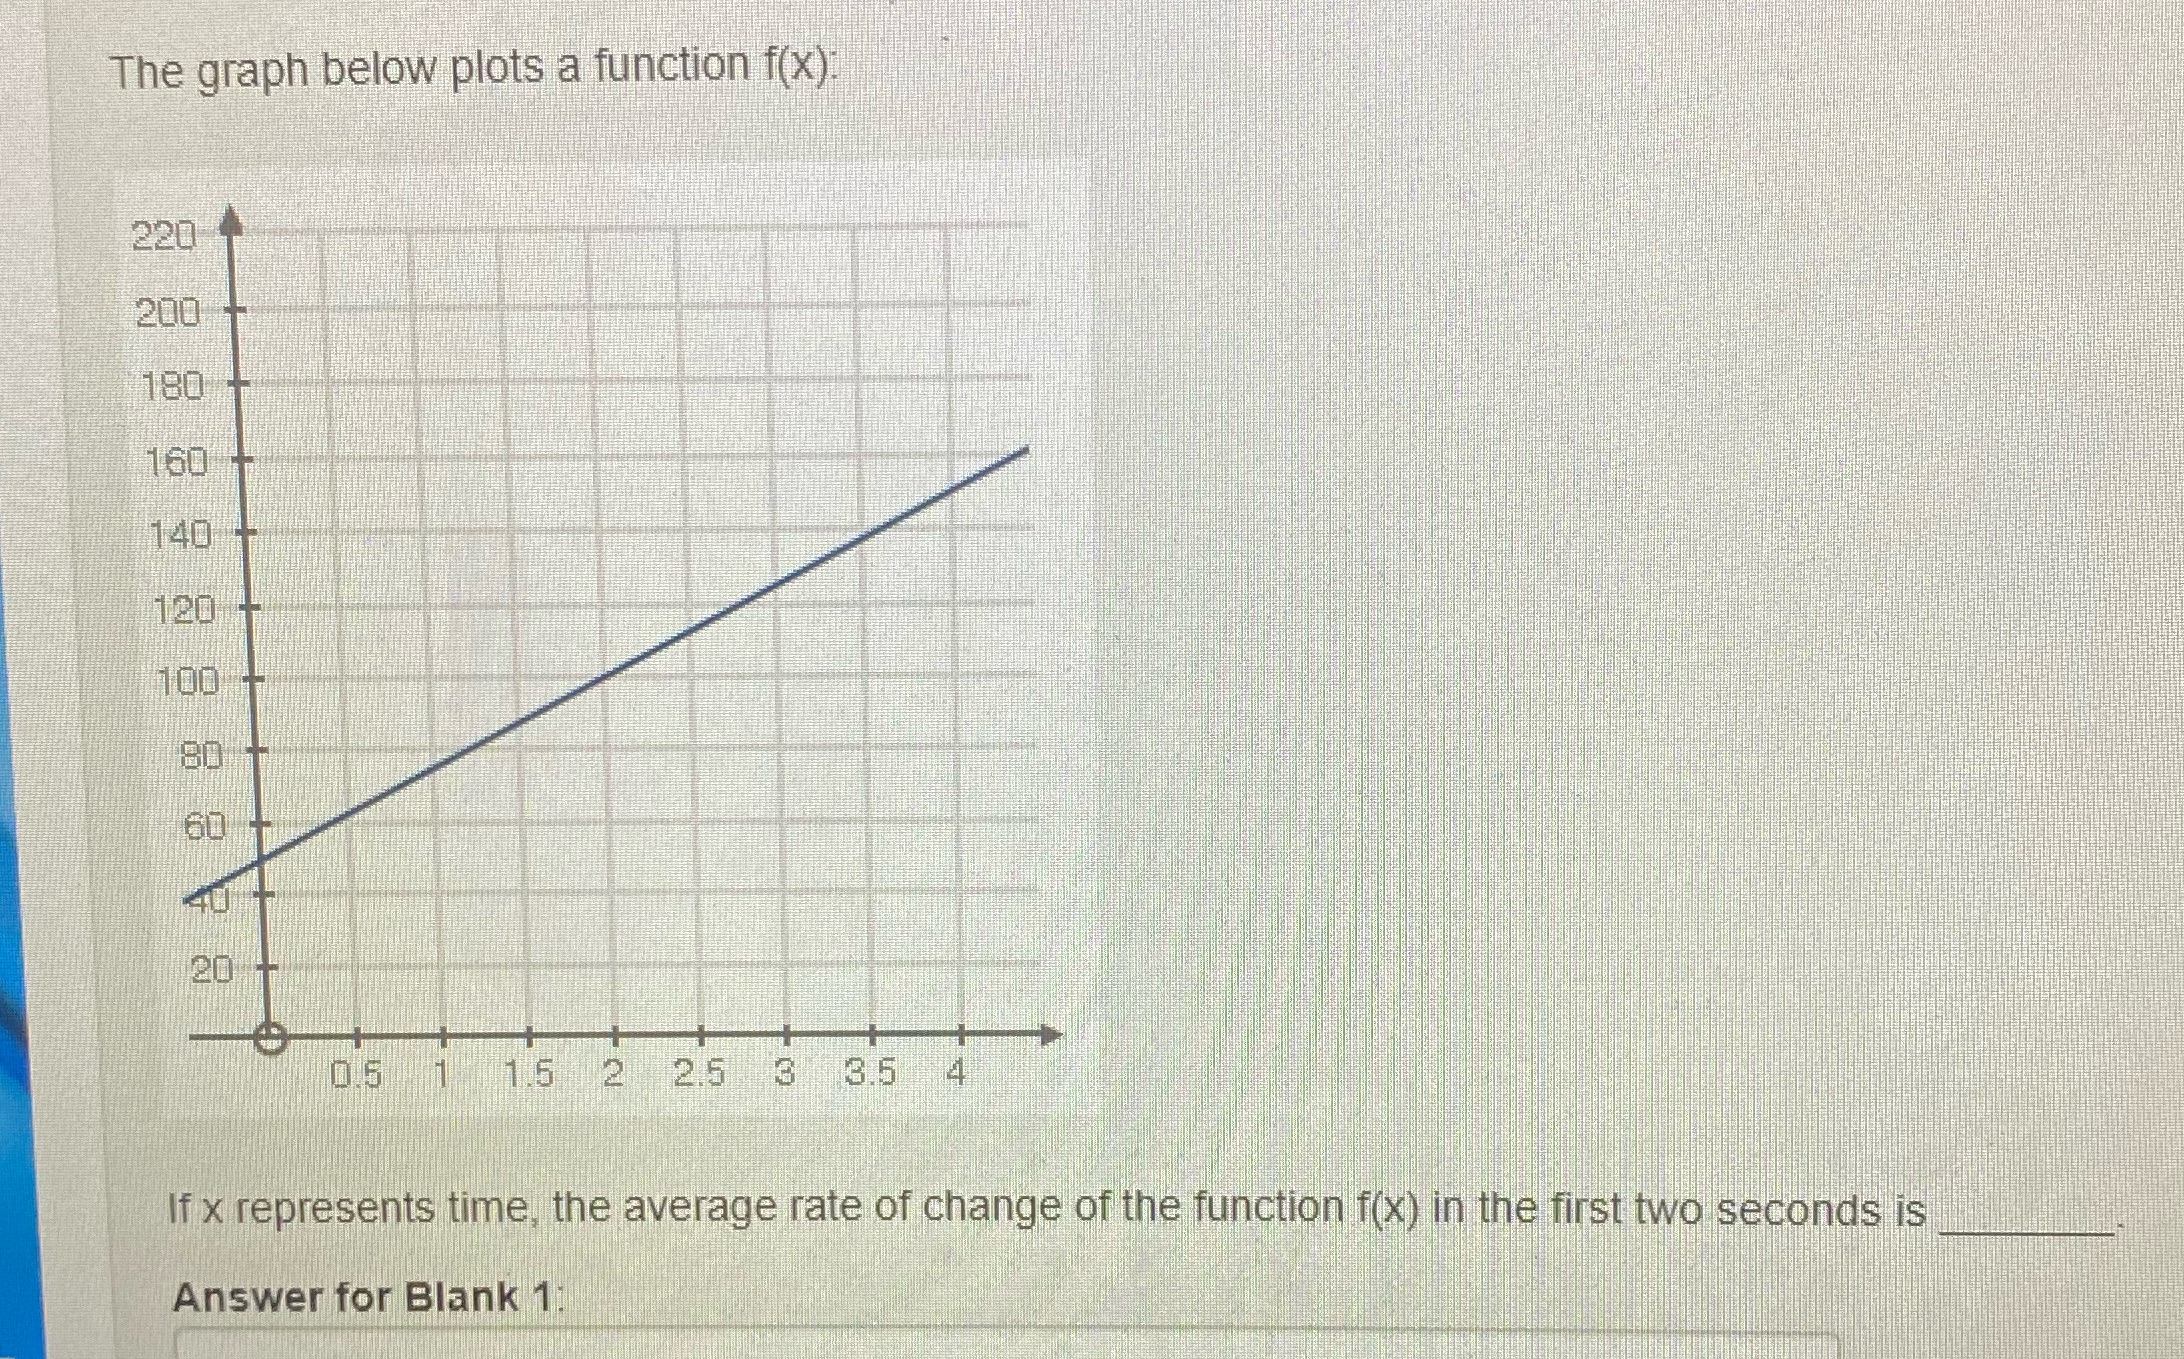
Question: The graph below plots a function f(x) 220 200 180 160 140 120 100 80 60 40 20 + 0.5 1 15 2 25 3

The graph below plots a function f(x) 220 200 180
The graph below plots a function f(x) 220 200 180 160 140 120 100 80 60 40 20 + 0.5 1 15 2 25 3 35 4 If x represents time, the average rate of change of the function f(x) in the first two seconds is Answer for Blank 1

Step by Step Solution

There are 3 Steps involved in it

1 Expert Approved Answer
Step: 1 Unlock blur-text-image
Question Has Been Solved by an Expert!

Get step-by-step solutions from verified subject matter experts

Step: 2 Unlock
Step: 3 Unlock

Students Have Also Explored These Related Mathematics Questions!