

Question: The graph below plots velocity vs . time for an object moving along a straight path. ( i ) ( a ) What is the
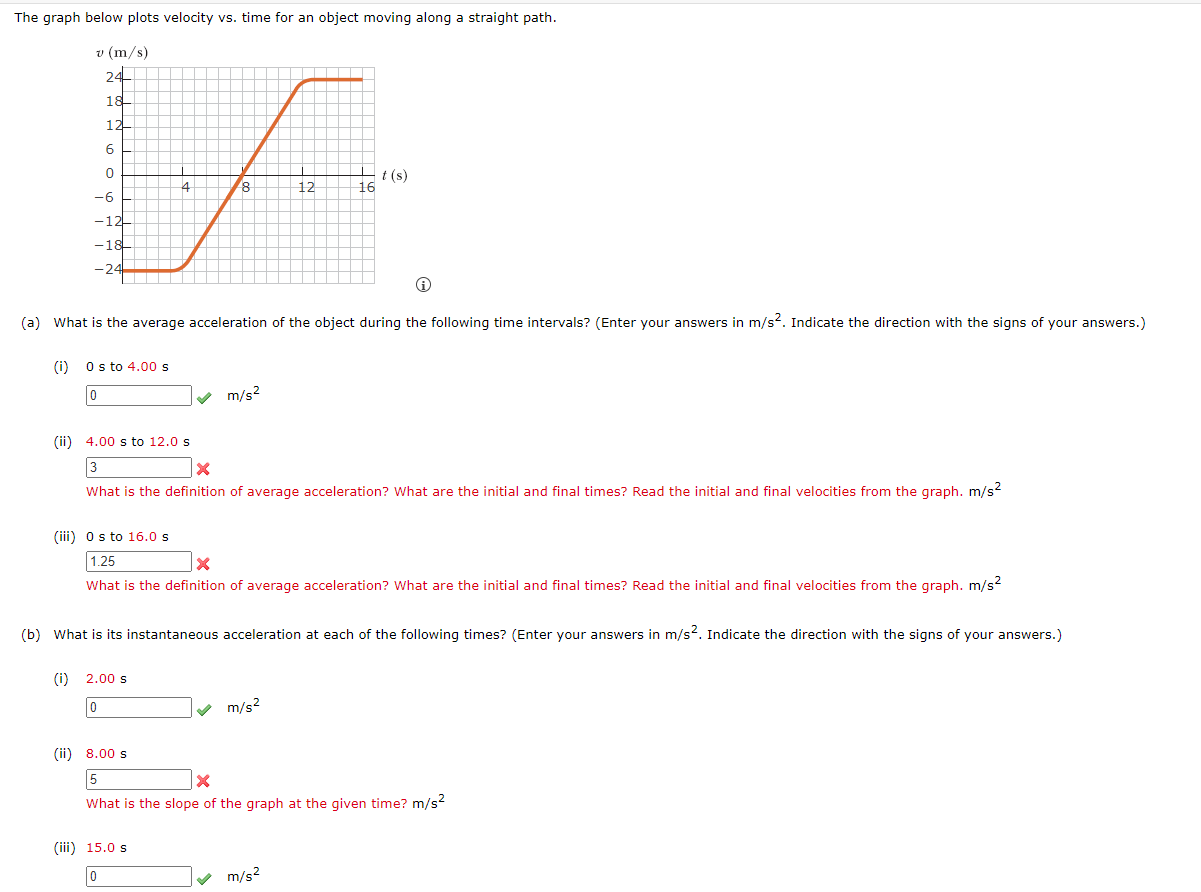
The graph below plots velocity vs time for an object moving along a straight path.
i
a What is the average acceleration of the object during the following time intervals? Enter your answers in Indicate the direction with the signs of your answers.
i to
ii to
What is the definition of average acceleration? What are the initial and final times? Read the initial and final velocities from the graph.
iii to
What is the definition of average acceleration? What are the initial and final times? Read the initial and final velocities from the graph.
b What is its instantaneous acceleration at each of the following times? Enter your answers in Indicate the direction with the signs of your answers.
i
ii
What is the slope of the graph at the given time?
iii
Step by Step Solution
There are 3 Steps involved in it
1 Expert Approved Answer
Step: 1 Unlock

Question Has Been Solved by an Expert!
Get step-by-step solutions from verified subject matter experts
Step: 2 Unlock
Step: 3 Unlock