

Question: The graph illustrates a normal distribution for the prices paid for a particular model of HD television. The mean price paid is $1000 and
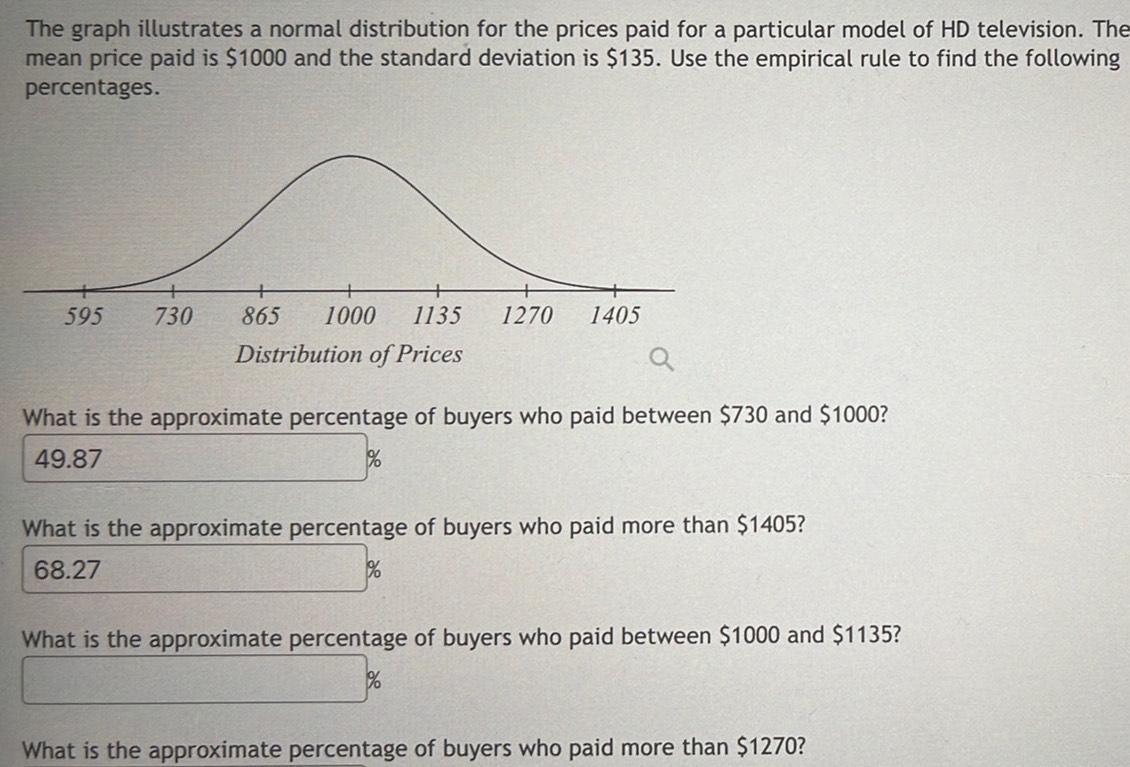
The graph illustrates a normal distribution for the prices paid for a particular model of HD television. The mean price paid is $1000 and the standard deviation is $135. Use the empirical rule to find the following percentages. 595 730 865 1000 1135 1270 1405 Distribution of Prices a What is the approximate percentage of buyers who paid between $730 and $1000? 49.87 % What is the approximate percentage of buyers who paid more than $1405? 68.27 % What is the approximate percentage of buyers who paid between $1000 and $1135? % What is the approximate percentage of buyers who paid more than $1270?
Step by Step Solution
There are 3 Steps involved in it

Get step-by-step solutions from verified subject matter experts