

Question: The graph portrays the decision criterion for a hypothesis test for a population mean. The null hypothesis is Hou = Jo. The curve is the
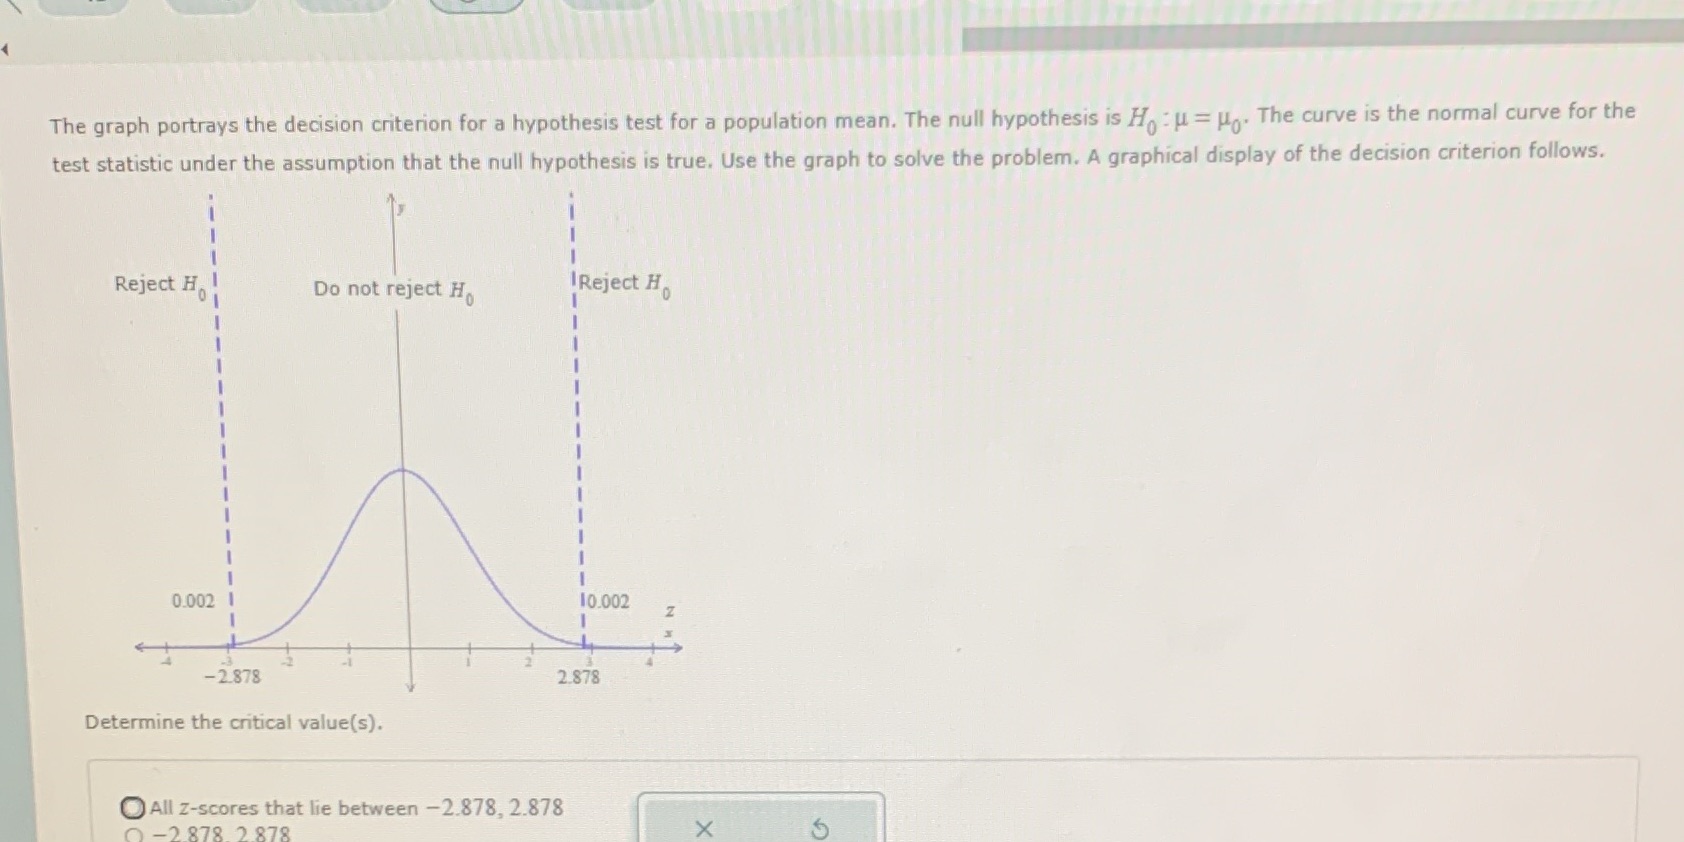
The graph portrays the decision criterion for a hypothesis test for a population mean. The null hypothesis is Hou = Jo. The curve is the normal curve for the test statistic under the assumption that the null hypothesis is true. Use the graph to solve the problem. A graphical display of the decision criterion follows. Reject Ho Do not reject H Reject H 0.002 10.002 IN N -2.878 2.878 Determine the critical value(s). All z-scores that lie between -2.878, 2.878 2 878 2878 X
Step by Step Solution
There are 3 Steps involved in it
1 Expert Approved Answer
Step: 1 Unlock

Question Has Been Solved by an Expert!
Get step-by-step solutions from verified subject matter experts
Step: 2 Unlock
Step: 3 Unlock