

Question: ............ The graph to the right shows the aggregate demand curve, short-run aggregate supply curve, and the long-run potential output for an economy 1.) Use
............
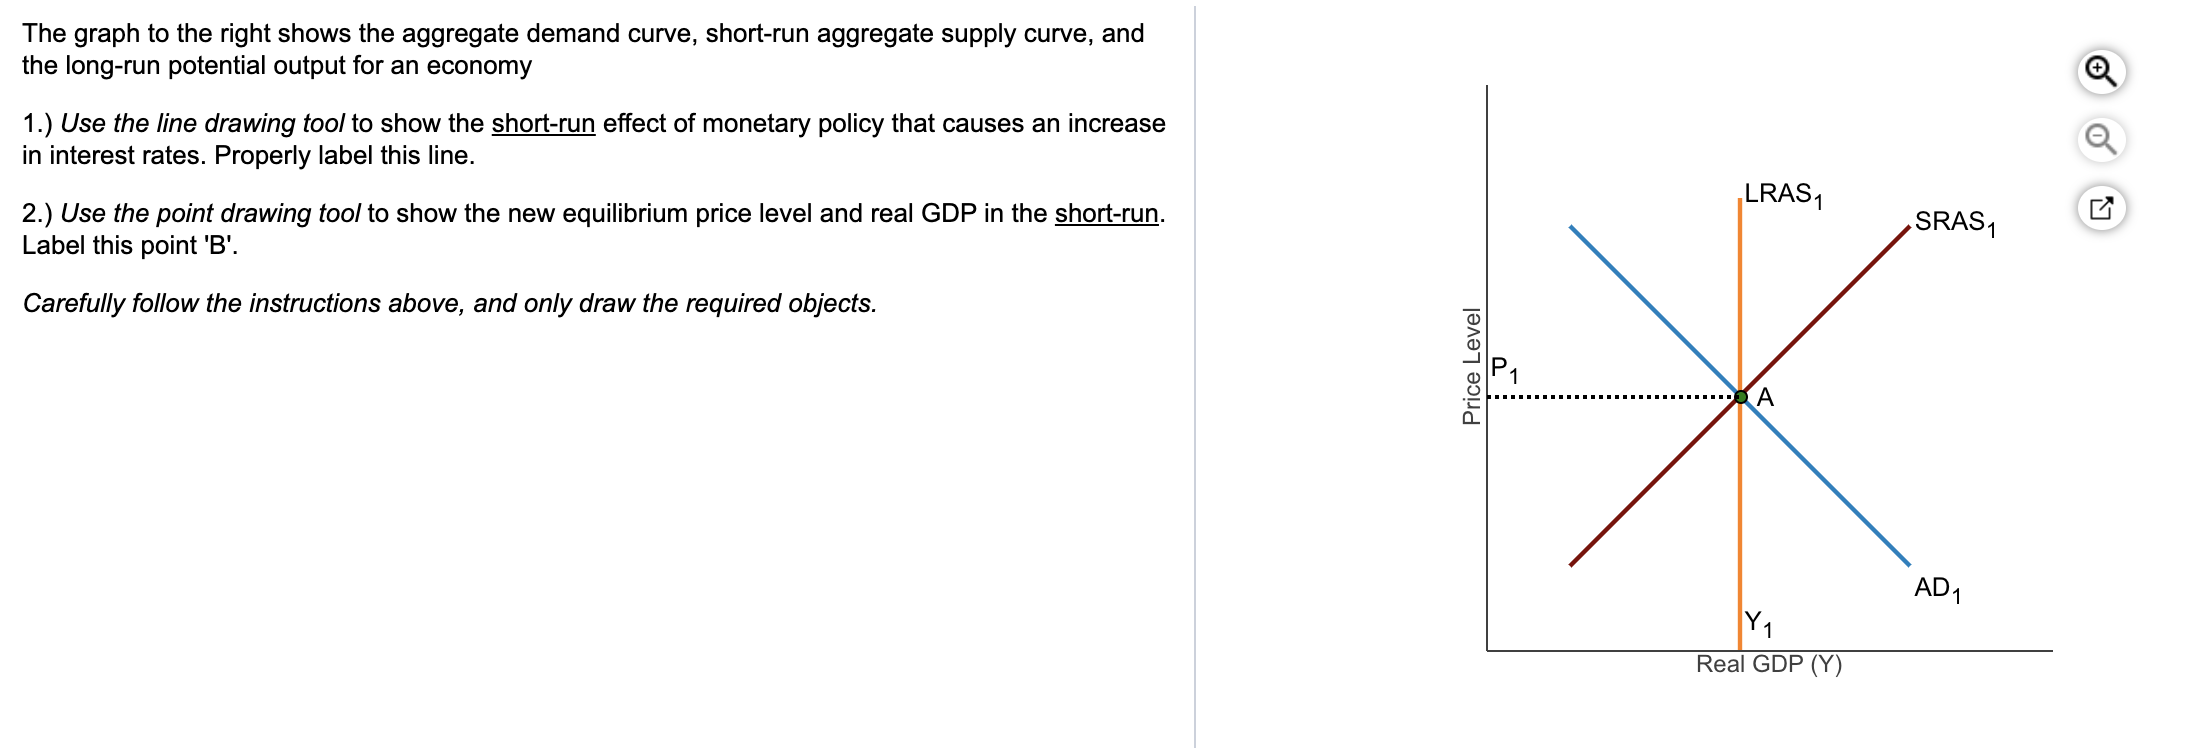
The graph to the right shows the aggregate demand curve, short-run aggregate supply curve, and the long-run potential output for an economy 1.) Use the line drawing tool to show the short-run effect of monetary policy that causes an increase in interest rates. Properly label this line. 2.) Use the point drawing tool to show the new equilibrium price level and real GDP in the shortrun. Label this point 'B'. Carefully follow the instructions above, and only draw the required objects. Price Level LRAS1 SRAs1 AD1 Real GDP (Y) 9,0
Step by Step Solution
There are 3 Steps involved in it
1 Expert Approved Answer
Step: 1 Unlock

Question Has Been Solved by an Expert!
Get step-by-step solutions from verified subject matter experts
Step: 2 Unlock
Step: 3 Unlock