

Question: The House Data: http://www.mediafire.com/file/2s49i93zc79nzlv/house_%25281%2529.rData/file Necessary R Packages: https://github.com/stan-dev/rstan/wiki/RStan-Getting-Started Textbook: Statistical Rethinking A Bayesian Course with Examples in R and Stan by Richard McElreath (https://b-ok.cc/book/5151197/193a53) Please
The House Data: http://www.mediafire.com/file/2s49i93zc79nzlv/house_%25281%2529.rData/file
Necessary R Packages: https://github.com/stan-dev/rstan/wiki/RStan-Getting-Started
Textbook: Statistical Rethinking A Bayesian Course with Examples in R and Stan by Richard McElreath (https://b-ok.cc/book/5151197/193a53)
Please help!
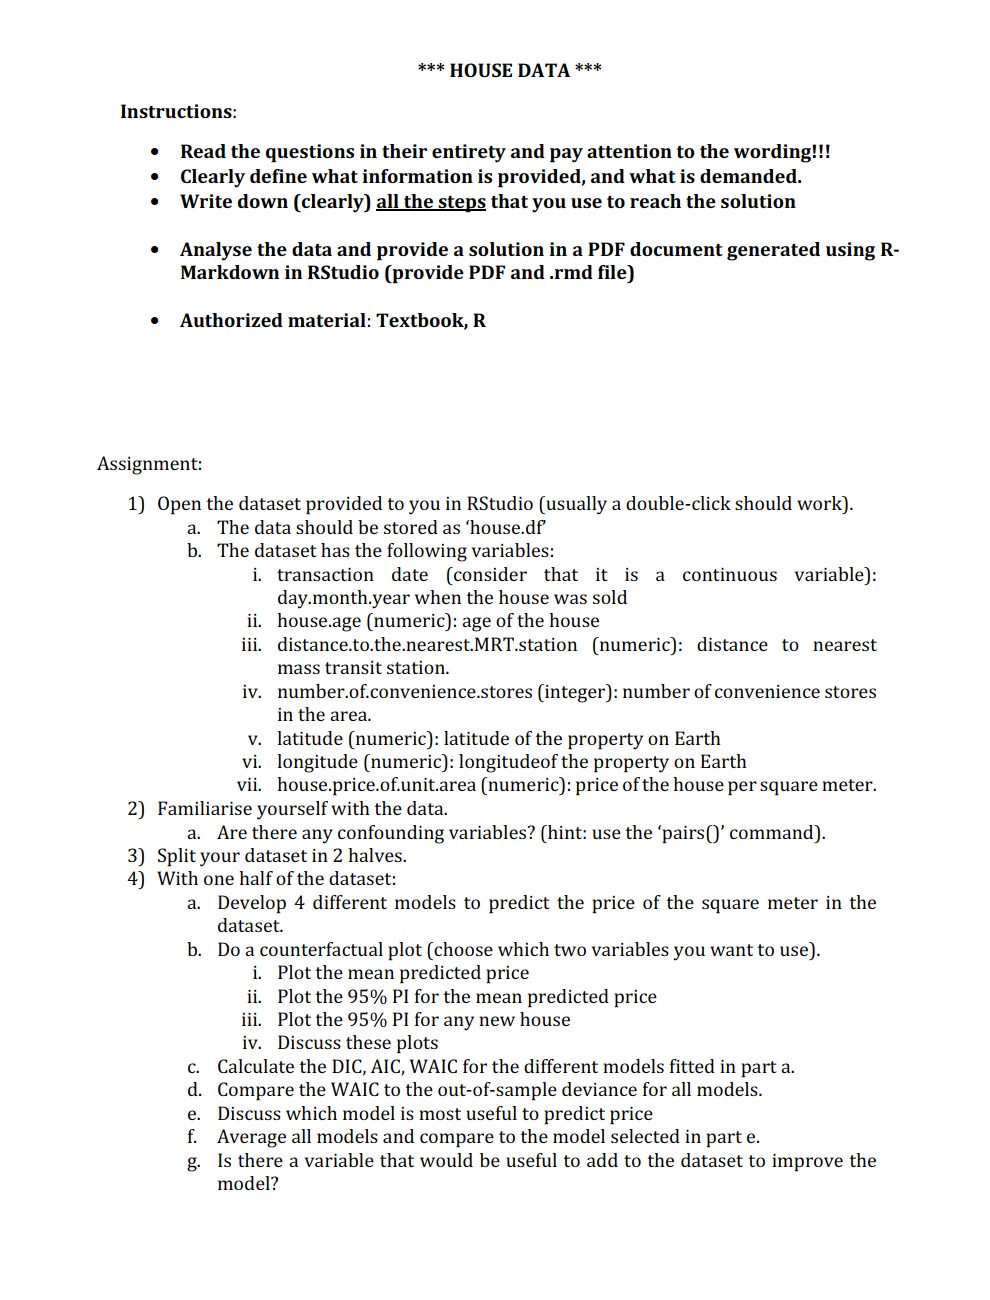
*** HOUSE DATA **"' Instructions: I Read the questions in their entirety and pay attention to the wording!!! I Clearly dene what information is provided, and what is demanded. I Write down [clearly] all the steps that you use to reach the solution I Analyse the data and provide a solution in a PDF document generated using R- Markdown in RStudio [provide PDF and .rmd le] I Authorized material: Textbook, R Assignment: 1] Open the dataset provided to you in RStudio [usually a double-click should work]. a. b. The data should be stored as 'house.df' The dataset has the following variables: i. transaction date [consider that it is a continuous variable]: day.rnonth.year when the house was sold ii. houseage [numeric]: age of the house iii. distance.to.the.nearestMRT.station [numeric]: distance to nearest mass transit station. iv. number.of.convenience.stores [integer]: number of convenience stores in the area. v. latitude [numeric]: latitude of the property on Earth vi. longitude [numeric]: longitudeof the property on Earth vii. house.price.of.unit.area [numeric]: price of the house per square meter. 2] Familiarise yourself with the data. a. Are there any confounding variables? (hint: use the 'pairs 0' command]. 3] Split your dataset in 2 halves. 4-] With one half of the dataset: a. b. swap-n Develop 4- different models to predict the price of the square meter in the dataset. Do a counterfactual plot [choose which two variables you want to use]. i. Plot the mean predicted price ii. Plot the 95% PI for the mean predicted price iii. Plot the 95% PI for any new house iv. Discuss these plots Calculate the BIG, AIC, WAIC for the different models tted in part a. Compare the WAIC to the out-of-sarnple deviance for all models. Discuss which model is most useful to predict price Average all models and compare to the model selected in part e. Is there a variable that would be useful to add to the dataset to improve the model
Step by Step Solution
There are 3 Steps involved in it

Get step-by-step solutions from verified subject matter experts