

Question: The income statement and balance sheet are the basic reports that a firm constructs for use by management and for distribution to stockholders, regulatory bodies,
The income statement and balance sheet are the basic reports that a firm constructs for use by management and for distribution to stockholders, regulatory bodies, and the general public. They are the primary sources of historical financial information about the firm. Dayton Products, Inc., is a moderate-sized manufacturer. The companys management has asked you to perform a detailed financial statement analysis of the firm. The income statements for the years ending December 31, 2012 and 2011, respectively, are presented in the table below. (Note: Purchases of inventory during 2012 amounted to $109,865.)
( I need formulas for each number)
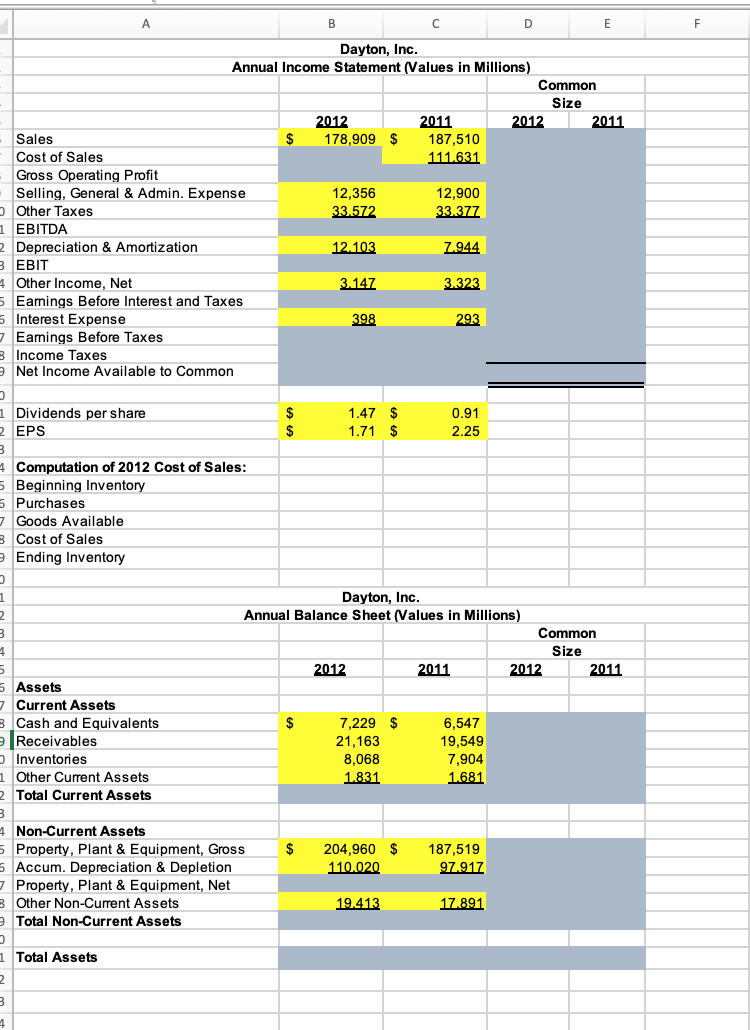
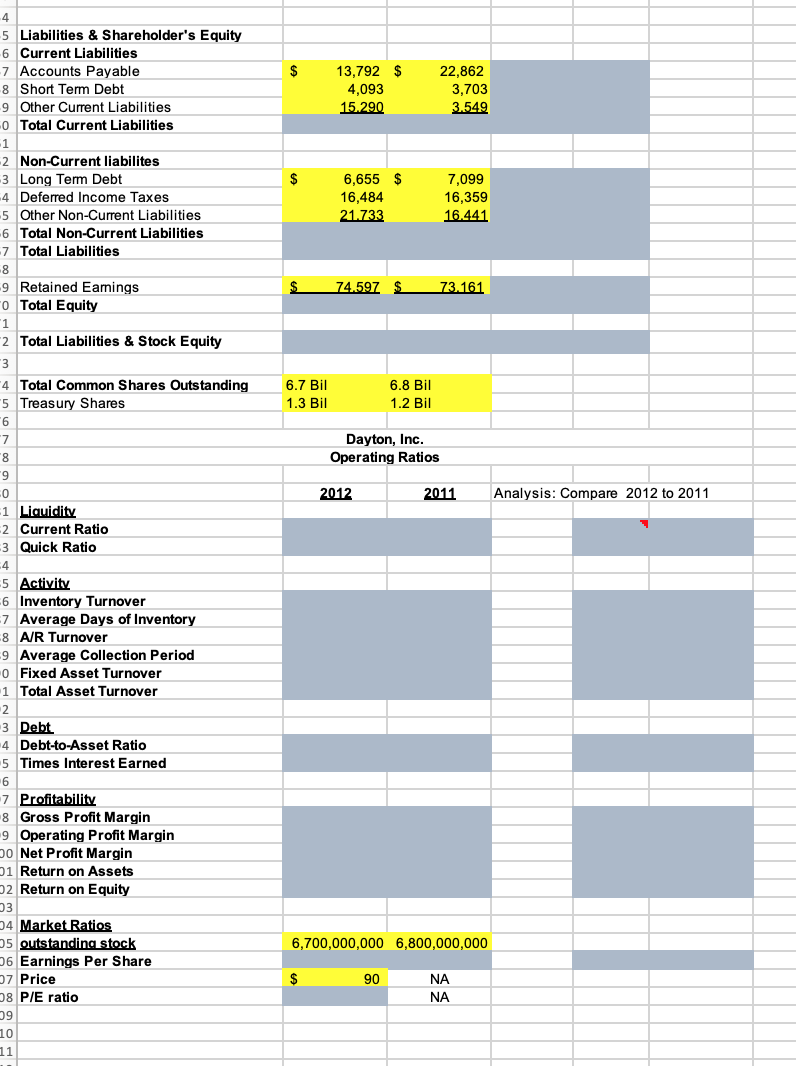
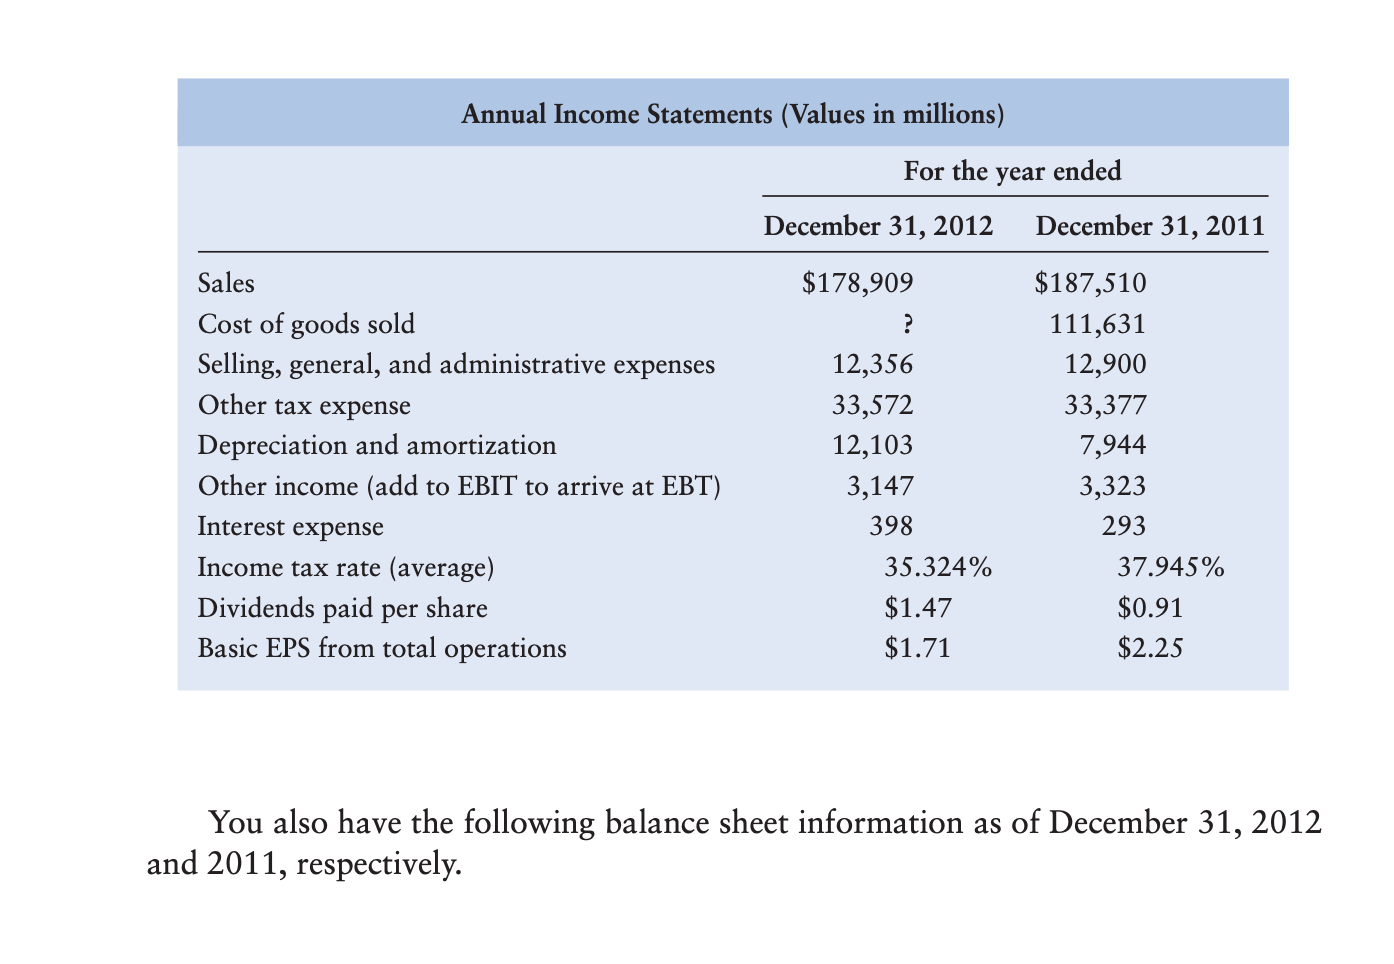
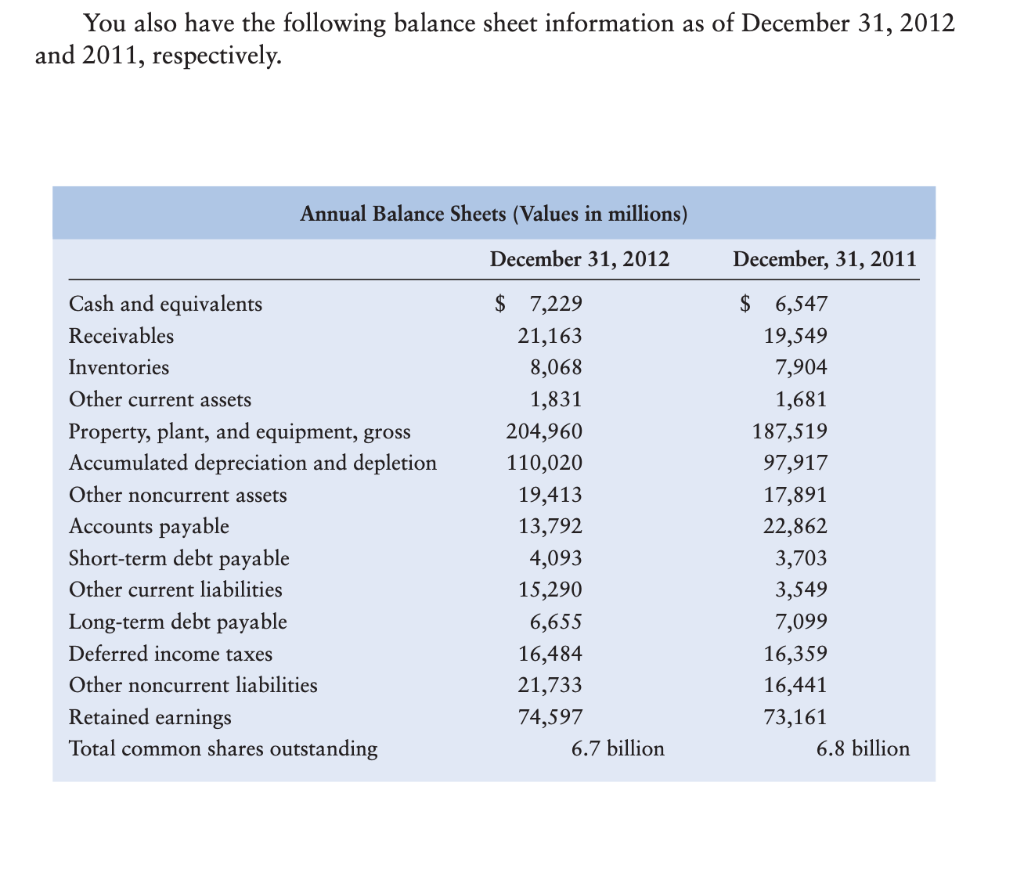
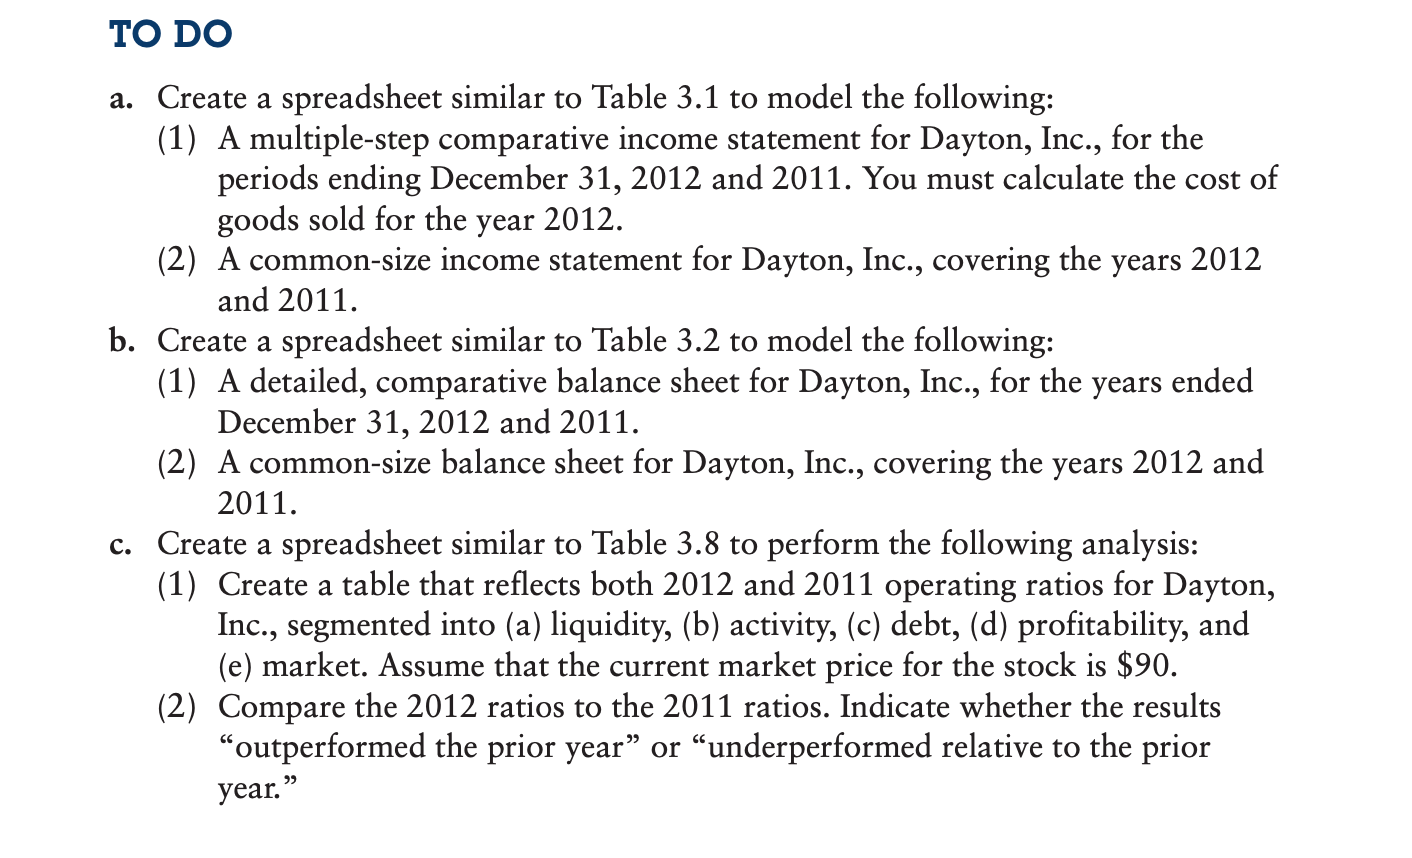
A B D E F Dayton, Inc. Annual Income Statement (Values in Millions) Common Size 2012 2011 2012 2011 Sales $ 178,909 $ 187,510 Cost of Sales 111.631 Gross Operating Profit Selling, General & Admin. Expense 12,356 12,900 Other Taxes 33.572 33.377 EBITDA Depreciation & Amortization 12.103 7.944 EBIT 4 Other Income, Net 3.147 3.323 5 Earnings Before Interest and Taxes 5 Interest Expense 398 293 Earnings Before Taxes 3 Income Taxes Net Income Available to Common 1 Dividends per share 2 EPS $ $ 1.47 $ 1.71 $ 0.91 2.25 Computation of 2012 Cost of Sales: 5 Beginning Inventory 5 Purchases 7 Goods Available s Cost of Sales Ending Inventory 1 2 3 4 5 Dayton, Inc. Annual Balance Sheet (Values in Millions) Common Size 2012 2011 2012 2011 $ Assets Current Assets Cash and Equivalents Receivables Inventories Other Current Assets Total Current Assets 7,229 $ 21,163 8,068 1.831 6,547 19,549 7,904 1.681 $ 204,960 $ 110.020 187,519 97,917 4 Non-Current Assets Property, Plant & Equipment, Gross Accum. Depreciation & Depletion 7 Property, Plant & Equipment, Net 3 Other Non-Current Assets Total Non-Current Assets 19.413 17.891 1 Total Assets 2 3 1 $ 13,792 $ 4,093 15 290 22,862 3,703 3.549 $ -4 5 Liabilities & Shareholder's Equity 6 Current Liabilities -7 Accounts Payable 8 Short Term Debt 9 Other Current Liabilities o Total Current Liabilities 1 2 Non-Current liabilites 3 Long Term Debt 4 Deferred Income Taxes -5 Other Non-Current Liabilities 6 Total Non-Current Liabilities 7 Total Liabilities -8 -9 Retained Earnings "o Total Equity 1 2 Total Liabilities & Stock Equity 3 -4 Total Common Shares Outstanding 5 Treasury Shares 6 6,655 $ 16,484 21.733 7,099 16,359 16.441 74.597 $ 73.161 6.7 Bil 1.3 Bil 6.8 Bil 1.2 Bil 7 Dayton, Inc. Operating Ratios 00 2012 2011 Analysis: Compare 2012 to 2011 9 0 -1 Liquidity -2 Current Ratio 3 Quick Ratio 4 -5 Activity -6 Inventory Turnover 7 Average Days of Inventory 8 A/R Turnover 9 Average Collection Period o Fixed Asset Turnover 1 Total Asset Turnover 2 3 Debt 4 Debt-to-Asset Ratio 5 Times Interest Earned 6 7 Profitability 8 Gross Profit Margin 9 Operating Profit Margin po Net Profit Margin 01 Return on Assets 2 Return on Equity 3 04 Market Ratios 5 outstanding stock 6 Earnings Per Share 7 Price 8 P/E ratio 39 10 11 6,700,000,000 6,800,000,000 $ 90 NA NA Annual Income Statements (Values in millions) For the year ended December 31, 2012 December 31, 2011 $178,909 n. Sales Cost of goods sold Selling, general, and administrative expenses Other tax expense Depreciation and amortization Other income (add to EBIT to arrive at EBT) Interest expense Income tax rate (average) Dividends paid per share Basic EPS from total operations 12,356 33,572 12,103 3,147 398 35.324% $1.47 $1.71 $187,510 111,631 12,900 33,377 7,944 3,323 293 37.945% $0.91 $2.25 You also have the following balance sheet information as of December 31, 2012 and 2011, respectively. You also have the following balance sheet information as of December 31, 2012 and 2011, respectively. Annual Balance Sheets (Values in millions) December 31, 2012 December, 31, 2011 Cash and equivalents Receivables Inventories Other current assets Property, plant, and equipment, gross Accumulated depreciation and depletion Other noncurrent assets Accounts payable Short-term debt payable Other current liabilities Long-term debt payable Deferred income taxes Other noncurrent liabilities Retained earnings Total common shares outstanding $ 7,229 21,163 8,068 1,831 204,960 110,020 19,413 13,792 4,093 15,290 6,655 16,484 21,733 74,597 6.7 billion $ 6,547 19,549 7,904 1,681 187,519 97,917 17,891 22,862 3,703 3,549 7,099 16,359 16,441 73,161 6.8 billion TO DO a. Create a spreadsheet similar to Table 3.1 to model the following: (1) A multiple-step comparative income statement for Dayton, Inc., for the periods ending December 31, 2012 and 2011. You must calculate the cost of goods sold for the year 2012. (2) A common-size income statement for Dayton, Inc., covering the years 2012 and 2011. b. Create a spreadsheet similar to Table 3.2 to model the following: (1) A detailed, comparative balance sheet for Dayton, Inc., for the years ended December 31, 2012 and 2011. (2) A common-size balance sheet for Dayton, Inc., covering the years 2012 and 2011. c. Create a spreadsheet similar to Table 3.8 to perform the following analysis: (1) Create a table that reflects both 2012 and 2011 operating ratios for Dayton, Inc., segmented into (a) liquidity, (b) activity, (c) debt, (d) profitability, and (e) market. Assume that the current market price for the stock is $90. (2) Compare the 2012 ratios to the 2011 ratios. Indicate whether the results "outperformed the prior year or underperformed relative to the prior year. A B D E F Dayton, Inc. Annual Income Statement (Values in Millions) Common Size 2012 2011 2012 2011 Sales $ 178,909 $ 187,510 Cost of Sales 111.631 Gross Operating Profit Selling, General & Admin. Expense 12,356 12,900 Other Taxes 33.572 33.377 EBITDA Depreciation & Amortization 12.103 7.944 EBIT 4 Other Income, Net 3.147 3.323 5 Earnings Before Interest and Taxes 5 Interest Expense 398 293 Earnings Before Taxes 3 Income Taxes Net Income Available to Common 1 Dividends per share 2 EPS $ $ 1.47 $ 1.71 $ 0.91 2.25 Computation of 2012 Cost of Sales: 5 Beginning Inventory 5 Purchases 7 Goods Available s Cost of Sales Ending Inventory 1 2 3 4 5 Dayton, Inc. Annual Balance Sheet (Values in Millions) Common Size 2012 2011 2012 2011 $ Assets Current Assets Cash and Equivalents Receivables Inventories Other Current Assets Total Current Assets 7,229 $ 21,163 8,068 1.831 6,547 19,549 7,904 1.681 $ 204,960 $ 110.020 187,519 97,917 4 Non-Current Assets Property, Plant & Equipment, Gross Accum. Depreciation & Depletion 7 Property, Plant & Equipment, Net 3 Other Non-Current Assets Total Non-Current Assets 19.413 17.891 1 Total Assets 2 3 1 $ 13,792 $ 4,093 15 290 22,862 3,703 3.549 $ -4 5 Liabilities & Shareholder's Equity 6 Current Liabilities -7 Accounts Payable 8 Short Term Debt 9 Other Current Liabilities o Total Current Liabilities 1 2 Non-Current liabilites 3 Long Term Debt 4 Deferred Income Taxes -5 Other Non-Current Liabilities 6 Total Non-Current Liabilities 7 Total Liabilities -8 -9 Retained Earnings "o Total Equity 1 2 Total Liabilities & Stock Equity 3 -4 Total Common Shares Outstanding 5 Treasury Shares 6 6,655 $ 16,484 21.733 7,099 16,359 16.441 74.597 $ 73.161 6.7 Bil 1.3 Bil 6.8 Bil 1.2 Bil 7 Dayton, Inc. Operating Ratios 00 2012 2011 Analysis: Compare 2012 to 2011 9 0 -1 Liquidity -2 Current Ratio 3 Quick Ratio 4 -5 Activity -6 Inventory Turnover 7 Average Days of Inventory 8 A/R Turnover 9 Average Collection Period o Fixed Asset Turnover 1 Total Asset Turnover 2 3 Debt 4 Debt-to-Asset Ratio 5 Times Interest Earned 6 7 Profitability 8 Gross Profit Margin 9 Operating Profit Margin po Net Profit Margin 01 Return on Assets 2 Return on Equity 3 04 Market Ratios 5 outstanding stock 6 Earnings Per Share 7 Price 8 P/E ratio 39 10 11 6,700,000,000 6,800,000,000 $ 90 NA NA Annual Income Statements (Values in millions) For the year ended December 31, 2012 December 31, 2011 $178,909 n. Sales Cost of goods sold Selling, general, and administrative expenses Other tax expense Depreciation and amortization Other income (add to EBIT to arrive at EBT) Interest expense Income tax rate (average) Dividends paid per share Basic EPS from total operations 12,356 33,572 12,103 3,147 398 35.324% $1.47 $1.71 $187,510 111,631 12,900 33,377 7,944 3,323 293 37.945% $0.91 $2.25 You also have the following balance sheet information as of December 31, 2012 and 2011, respectively. You also have the following balance sheet information as of December 31, 2012 and 2011, respectively. Annual Balance Sheets (Values in millions) December 31, 2012 December, 31, 2011 Cash and equivalents Receivables Inventories Other current assets Property, plant, and equipment, gross Accumulated depreciation and depletion Other noncurrent assets Accounts payable Short-term debt payable Other current liabilities Long-term debt payable Deferred income taxes Other noncurrent liabilities Retained earnings Total common shares outstanding $ 7,229 21,163 8,068 1,831 204,960 110,020 19,413 13,792 4,093 15,290 6,655 16,484 21,733 74,597 6.7 billion $ 6,547 19,549 7,904 1,681 187,519 97,917 17,891 22,862 3,703 3,549 7,099 16,359 16,441 73,161 6.8 billion TO DO a. Create a spreadsheet similar to Table 3.1 to model the following: (1) A multiple-step comparative income statement for Dayton, Inc., for the periods ending December 31, 2012 and 2011. You must calculate the cost of goods sold for the year 2012. (2) A common-size income statement for Dayton, Inc., covering the years 2012 and 2011. b. Create a spreadsheet similar to Table 3.2 to model the following: (1) A detailed, comparative balance sheet for Dayton, Inc., for the years ended December 31, 2012 and 2011. (2) A common-size balance sheet for Dayton, Inc., covering the years 2012 and 2011. c. Create a spreadsheet similar to Table 3.8 to perform the following analysis: (1) Create a table that reflects both 2012 and 2011 operating ratios for Dayton, Inc., segmented into (a) liquidity, (b) activity, (c) debt, (d) profitability, and (e) market. Assume that the current market price for the stock is $90. (2) Compare the 2012 ratios to the 2011 ratios. Indicate whether the results "outperformed the prior year or underperformed relative to the prior year
Step by Step Solution
There are 3 Steps involved in it

Get step-by-step solutions from verified subject matter experts