

Question: The intersection shown in Figure 2 1 - 1 5 is to be analyzed using the HCM 2 0 0 0 methodology. All computations are
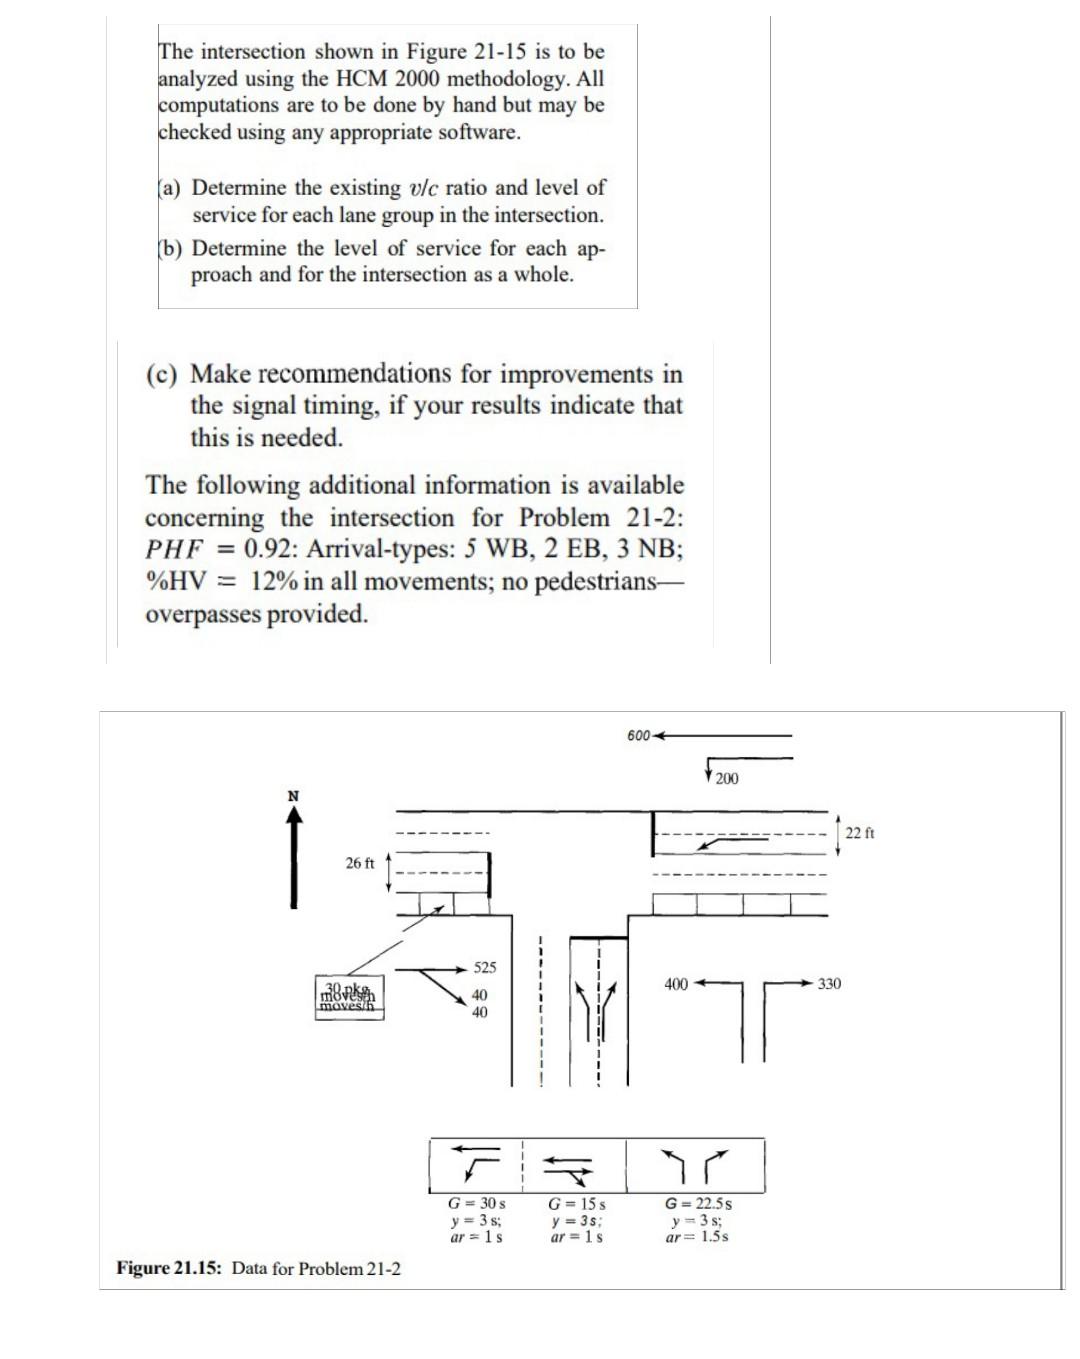
The intersection shown in Figure is to be analyzed using the HCM methodology. All computations are to be done by hand but may be checked using any appropriate software.
a Determine the existing ratio and level of service for each lane group in the intersection.
b Determine the level of service for each approach and for the intersection as a whole.
c Make recommendations for improvements in the signal timing, if your results indicate that this is needed.
The following additional information is available concerning the intersection for Problem : : Arrivaltypes: ; in all movements; no pedestriansoverpasses provided.
Figure : Data for Problem
Step by Step Solution
There are 3 Steps involved in it
1 Expert Approved Answer
Step: 1 Unlock

Question Has Been Solved by an Expert!
Get step-by-step solutions from verified subject matter experts
Step: 2 Unlock
Step: 3 Unlock