

Question: The management team had been using collective judgment to prepare the forecast for the past 12 months. The managements forecasts are shown in the following
 The management team had been using collective judgment to prepare the forecast for the past 12 months. The managements forecasts are shown in the following table. What are the values of MAD, MAPE, MSE, and TS for the managements forecasts? (6pts)
Month1 2 3 4 5 6 7 8 9 10 11 12
Forecast 901 1,043 1,245 1,350 1,555 1,624 1,689 1,806 1,823 2,041 2,113 2,132
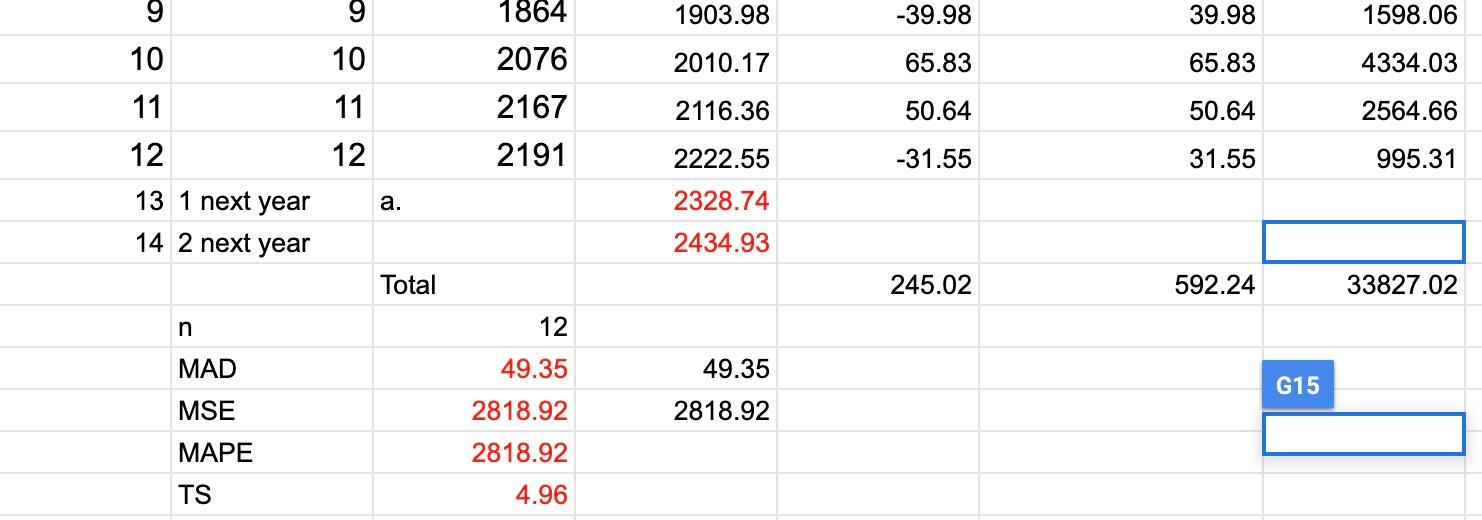
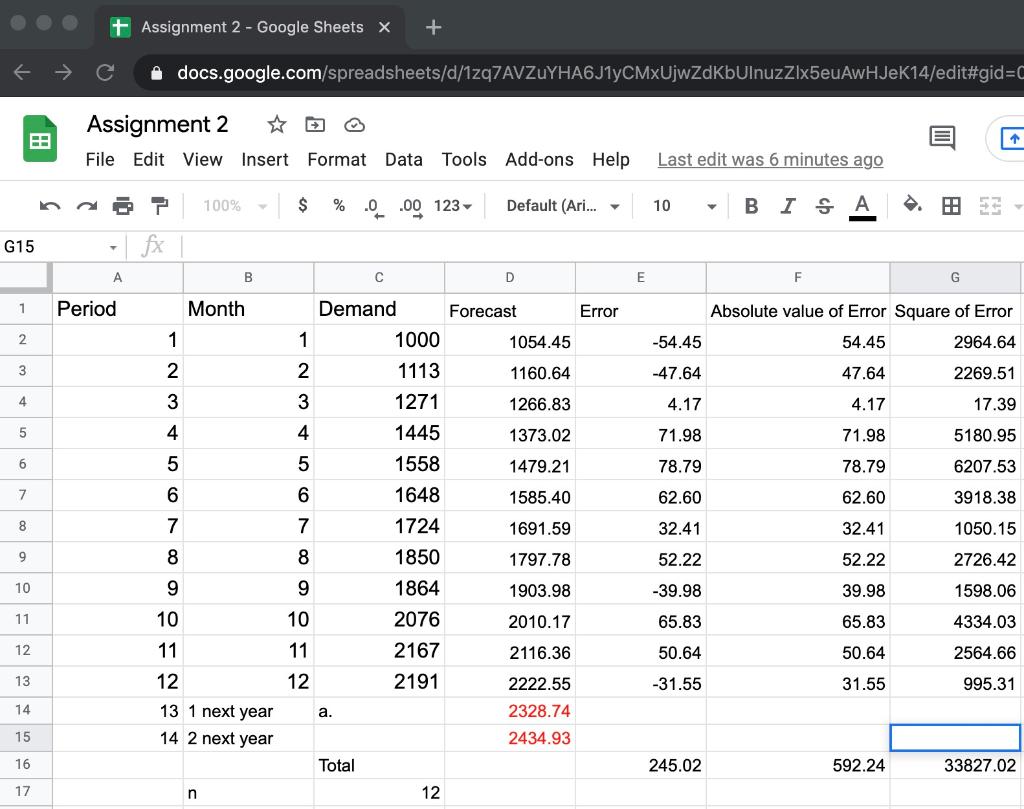
9 1903.98 -39.98 39.98 1598.06 1864 2076 10 2010.17 65.83 65.83 4334.03 11 10 11 12 2116.36 50.64 50.64 2564.66 2167 2191 2222.55 -31.55 31.55 995.31 12 13 1 next year 14 2 next year 2328.74 2434.93 Total 245.02 592.24 33827.02 n 12 MAD 49.35 49.35 2818.92 G15 MSE 2818.92 MAPE 2818.92 TS 4.96 + Assignment 2 - Google Sheets x + docs.google.com/spreadsheets/d/1zq7AVZUYHA6J1yCMxUjwZdKbUlnuzZlx5euAwHJEK14/edit#gid=0 Assignment 2 File Edit View Insert Format Data 1 Tools Add-ons Help Last edit was 6 minutes ago 100% $ % 0.00 123 Default (Ari... 10 BI & A .58 G15 f A B D E F G 1 Period Month Forecast Error Absolute value of Error Square of Error Demand 1000 2 1 1 1054.45 -54.45 54.45 2964.64 3 WN 1113 1160.64 -47.64 47.64 2269.51 4 1266.83 4.17 4.17 17.39 5 4 OD W N 4 1271 1445 1558 1373.02 71.98 71.98 5180.95 6 5 5 1479.21 78.79 78.79 6207.53 7 6 1648 1585.40 62.60 62.60 3918.38 8 7 7 1691.59 32.41 32.41 1050.15 9 8 8 1797.78 52.22 52.22 2726.42 10 1903.98 -39.98 39.98 1598.06 9 10 1724 1850 1864 2076 2167 2191 9 10 11 11 2010.17 65.83 65.83 4334.03 12 11 2116.36 50.64 50.64 2564.66 13 12 12 -31.55 31.55 995.31 2222.55 2328.74 14 a. 13 1 next year 14 2 next year 15 2434.93 16 Total 245.02 592.24 33827.02 17 n 12Step by Step Solution
There are 3 Steps involved in it
1 Expert Approved Answer
Step: 1 Unlock

Question Has Been Solved by an Expert!
Get step-by-step solutions from verified subject matter experts
Step: 2 Unlock
Step: 3 Unlock