

Question: The MatLab part is what I need help on please. Much appreciated EML 3523C Experimental Methodology Summer 2017 Project 1: Amplitude Spectrum of a Deterministic
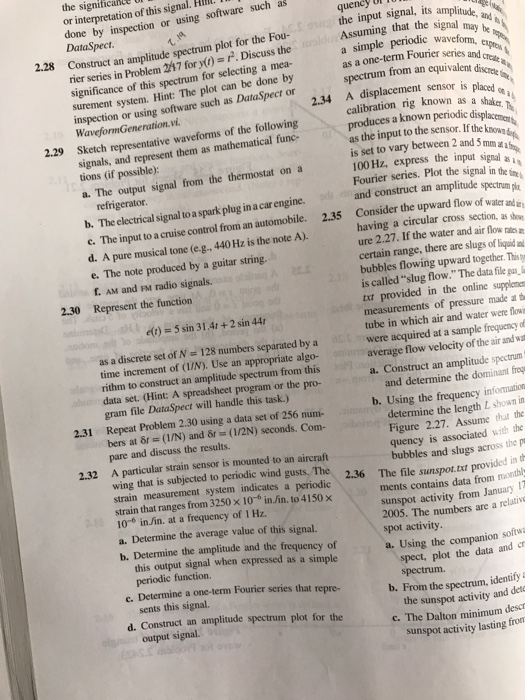
EML 3523C Experimental Methodology Summer 2017 Project 1: Amplitude Spectrum of a Deterministic Sinusoid due June 5, 2017 by 5pm thru CANVAS Solve problems 2.30 and 2.31 in the textbook with addition of the following terms (7sin 18.84t +4sin 37.68t 3sin 56.5t) to eC), using the Fast Fourier Transform algorithm by via Matlab and Labview. In addition to what the textbook asks, compare and contrast the two different programs in computing the amplitude spectrum. Follow the reporting formats provided earlier by T. A. & on CANVAS. Hints for Matlab: For plotting the amplitude spectrum, instead of plot (fA), use stem(f.A) to create the plot of the frequency vector f versus the amplitude vector A Hints for Labview: Under the "Spectral Measurements" block, choose "None" under windowing. Do not use for while loop for this project; the simulate signal block can output as many data points as needed without the use of a loop. eu has 5 terms
Step by Step Solution
There are 3 Steps involved in it

Get step-by-step solutions from verified subject matter experts