

The Operations manager of AZOON Company which sells supplies (specifically, oven and dishwasher) was trying to simulate
Question:
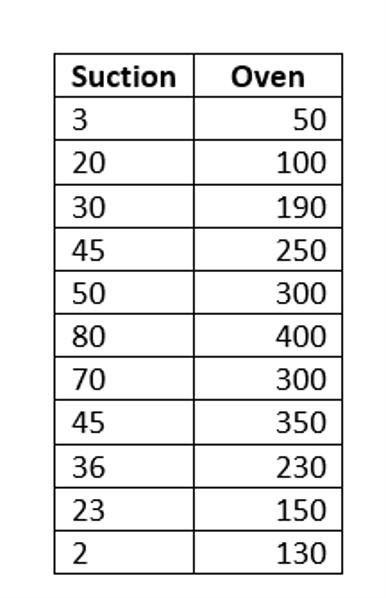
The Operations manager of AZOON Company which sells supplies (specifically, oven and dishwasher) was trying to simulate their orders against the demand of Oven. It was noted that in the previous months the demand of the Suctions was so uncertain and has a uniform distribution probability with a minimum demand of 3 and a maximum if 100 units. Moreover, it has also noticed that the Oven demand has a linear relationship with the Suction demand as shown in the table below:
Since uncertainty is quite high in the demand, they are concerned about the cost of inventory at the end of each month which is said to be $60 per unit however the shortage cost is estimated to be $12. This particular product is sold at $600 but for the fast-moving product during December, January and April, the company increases the price to 10% more and put back to normal price on the other months. Their yearly fixed cost is estimated to be $9000 daily.
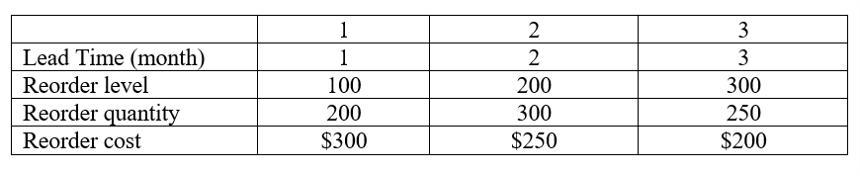
a. Create a year simulation showing the monthly profit and the total profit for the whole simulation period. Using the following different strategies:
b. Generate the summary report showing the number of months when stock out occurred, the mean of the closing stock level, number of orders placed, number of times there were back orders.
c. Which among strategies is the most appropriate for the company and why?
d. After selecting the best strategy, show at what demand the company with have the best profit?
Expert Answer:
a For strategy 1 the reorder level is 100 and the reorder quantity is 200 The reorder cost is 300 Month Demand Closing Stock Profit January 50 150 120... View the full answer


Statistics for Management and Economics Abbreviated
ISBN: 978-1285869643
10th Edition
Authors: Gerald Keller
