

Question: The R - chart A . control limits are computed using sample standard deviations. B . is used to measure changes in the central tendency.
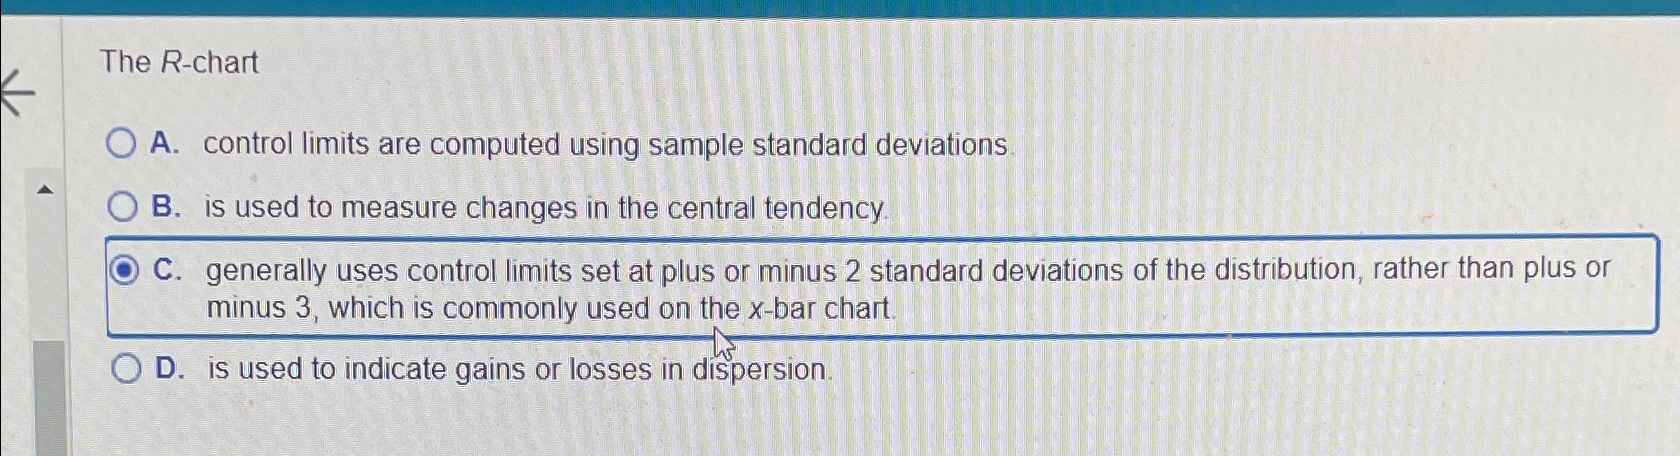
The Rchart
A control limits are computed using sample standard deviations.
B is used to measure changes in the central tendency.
C generally uses control limits set at plus or minus standard deviations of the distribution, rather than plus or minus which is commonly used on the bar chart.
D is used to indicate gains or losses in dispersion.
Step by Step Solution
There are 3 Steps involved in it
1 Expert Approved Answer
Step: 1 Unlock

Question Has Been Solved by an Expert!
Get step-by-step solutions from verified subject matter experts
Step: 2 Unlock
Step: 3 Unlock