

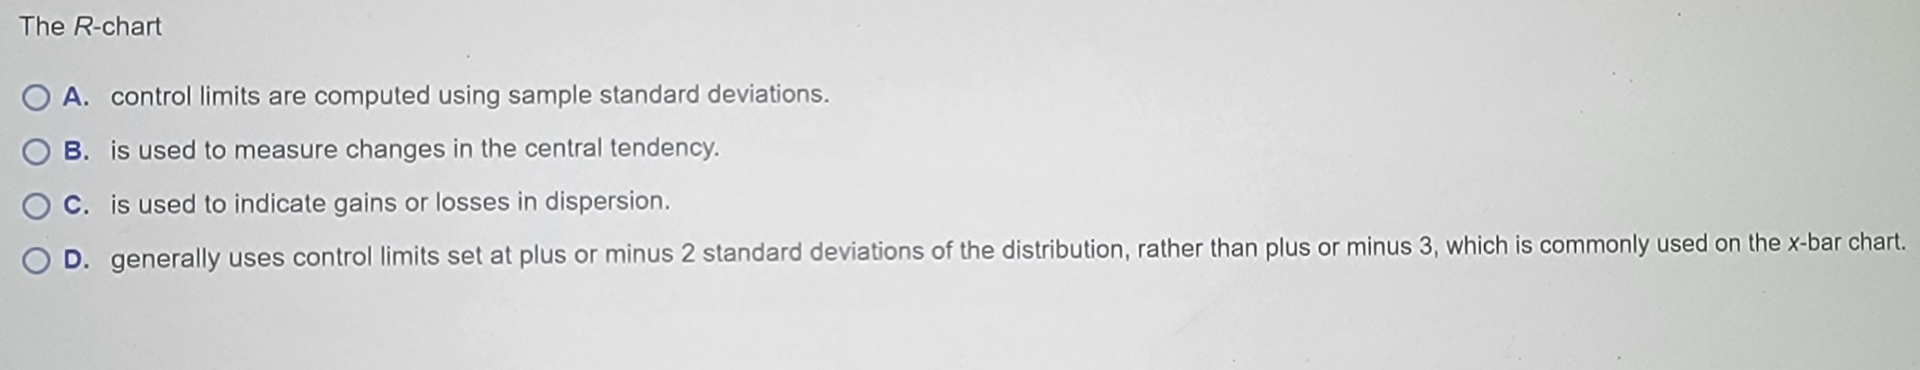
Question: The R - chart A . control limits are computed using sample standard deviations. B . is used to measure changes in the central tendency.
The chart
A control limits are computed using sample standard deviations.
B is used to measure changes in the central tendency.
C is used to indicate gains or losses in dispersion.
D generally uses control limits set at plus or minus standard deviations of the distribution, rather than plus or minus which is commonly used on the bar chart.
Step by Step Solution
There are 3 Steps involved in it
1 Expert Approved Answer
Step: 1 Unlock

Question Has Been Solved by an Expert!
Get step-by-step solutions from verified subject matter experts
Step: 2 Unlock
Step: 3 Unlock